Blog
Writing about data science, energy, technology, and the things I build.

Migrating from Blogdown to Astro (with a little help from AI)
After 6 years on Hugo and Blogdown, I finally rebuilt my blog from scratch with Astro, React, and Tailwind CSS. Here's why I made the switch, the options I considered, and how Claude helped me migrate 22 posts in an afternoon.
4 Lessons from the smart home
2 years and 100 devices later. What are my top recommendations in setting up your own smart home?
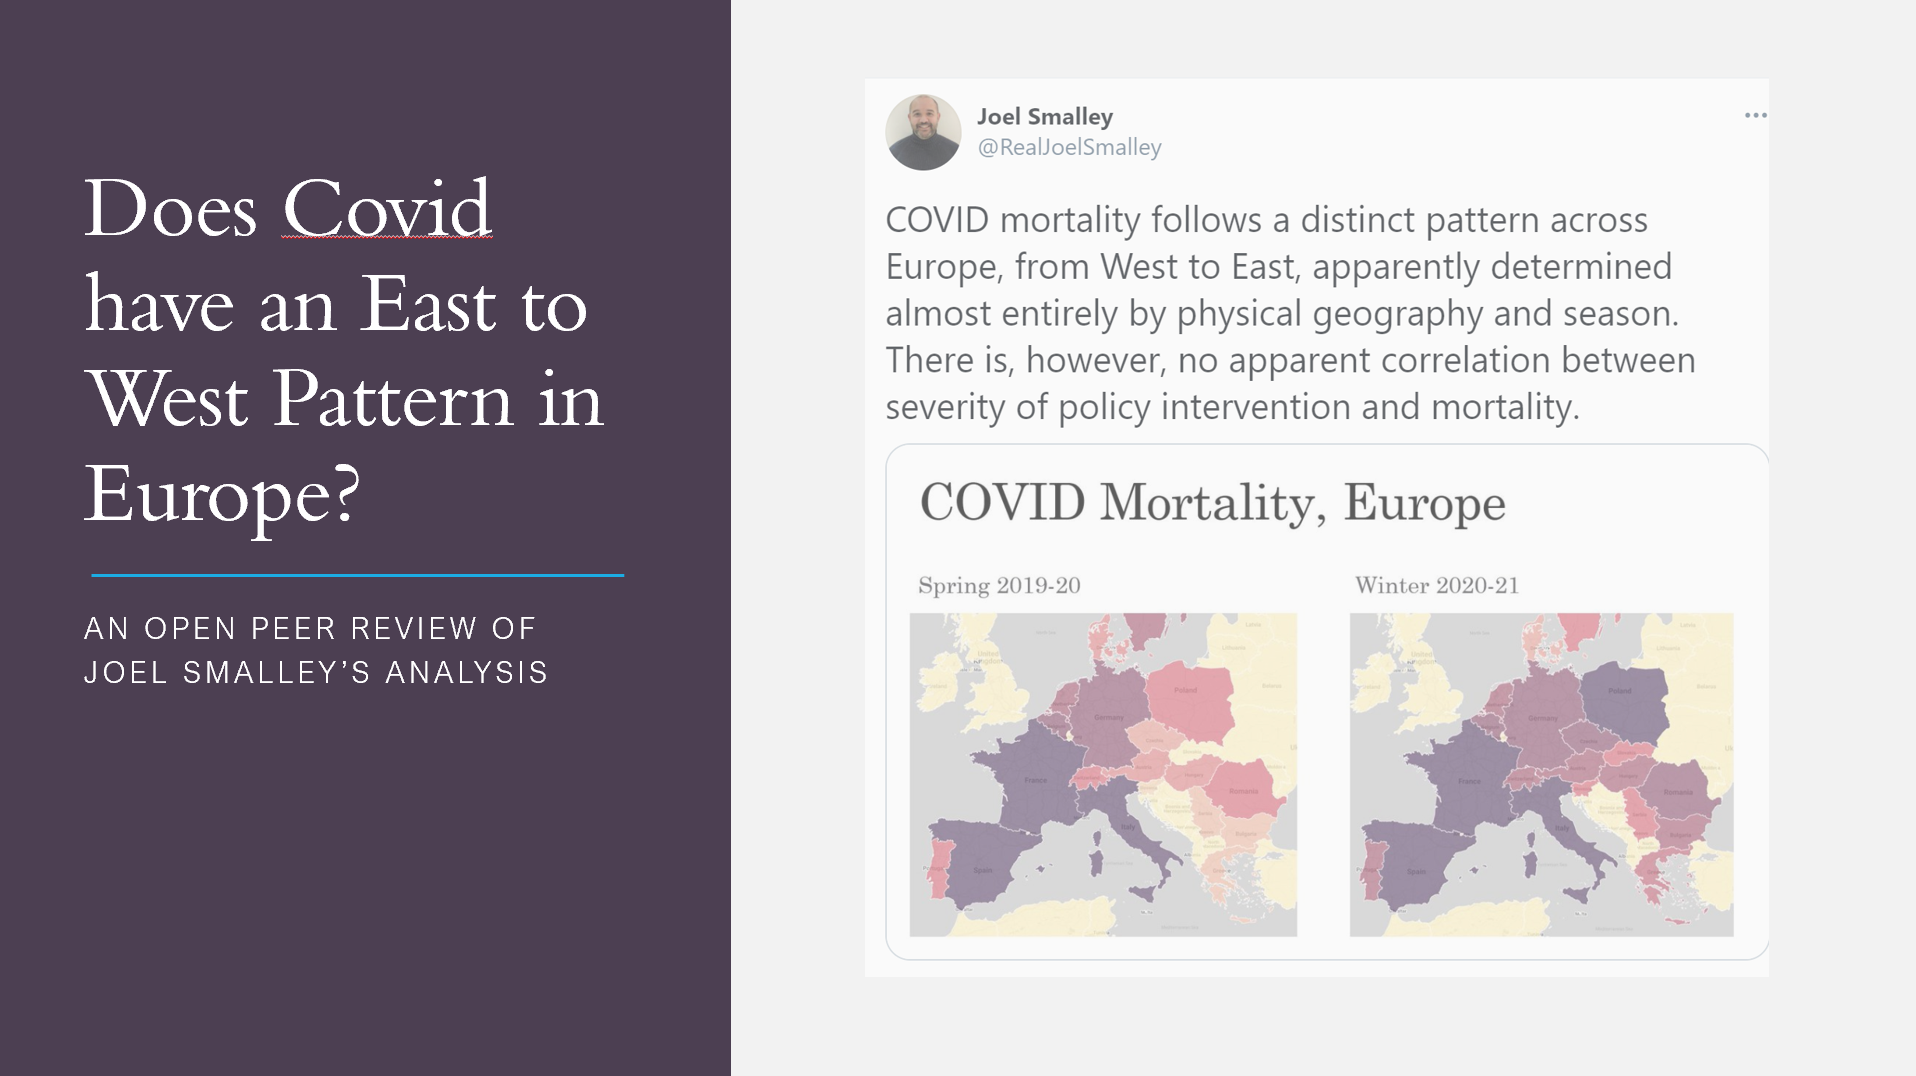
East/West patterns in Covid-19: validating claims of correlation
A review of analysis by Joel Smalley.
Daily Covid-19 deaths statistics: an explainer
A guide on how to interpret the daily death statistics published released in the UK.
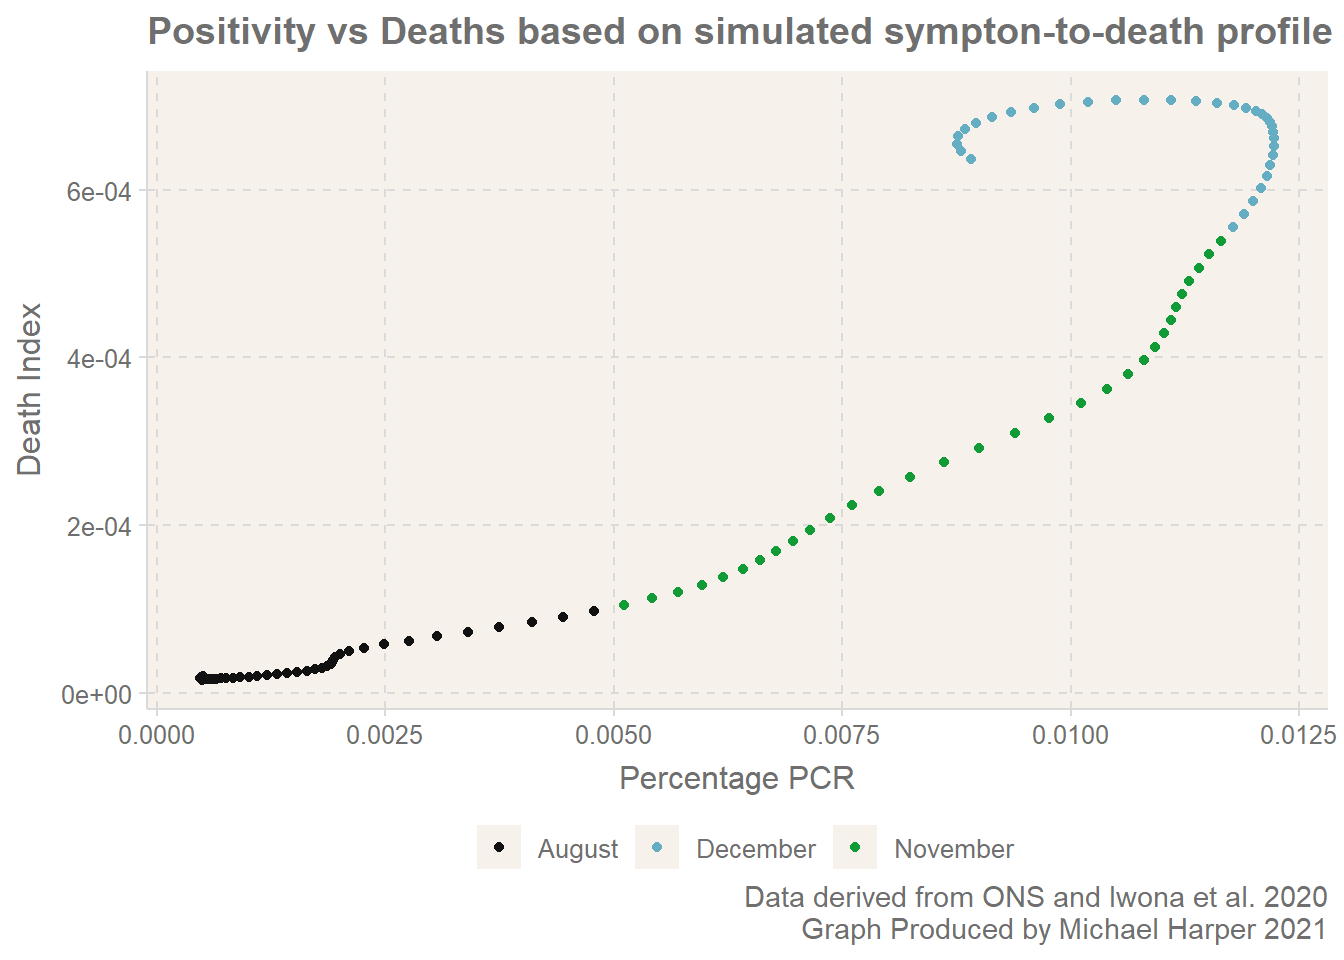
Why COVID positivity rates and deaths don't always correlate
A review of analysis by Joel Smalley, and simulated results to highlight concerns surrounding the interpretation of the statistics.
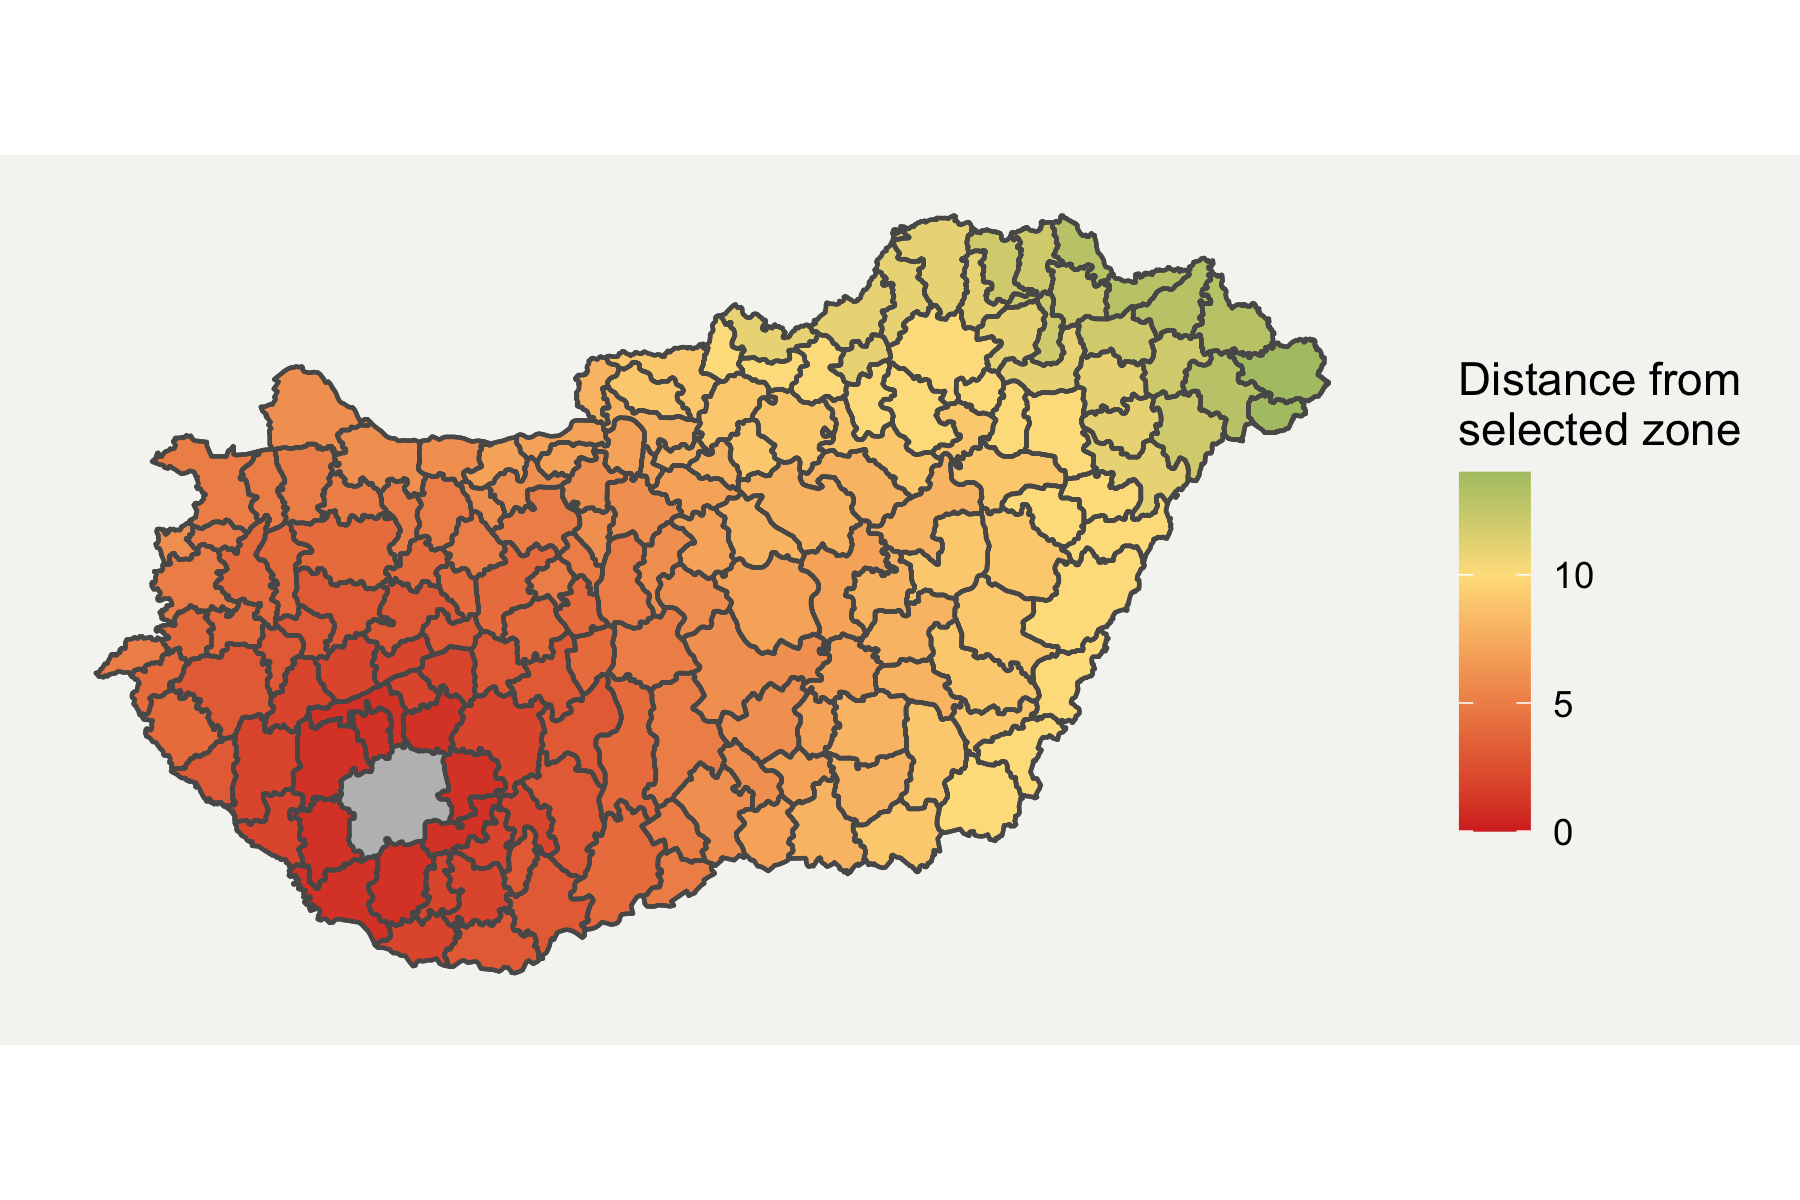
Visualising Neighbouring Polygons in R
Guide on how to make neighbouring boundary maps in R.
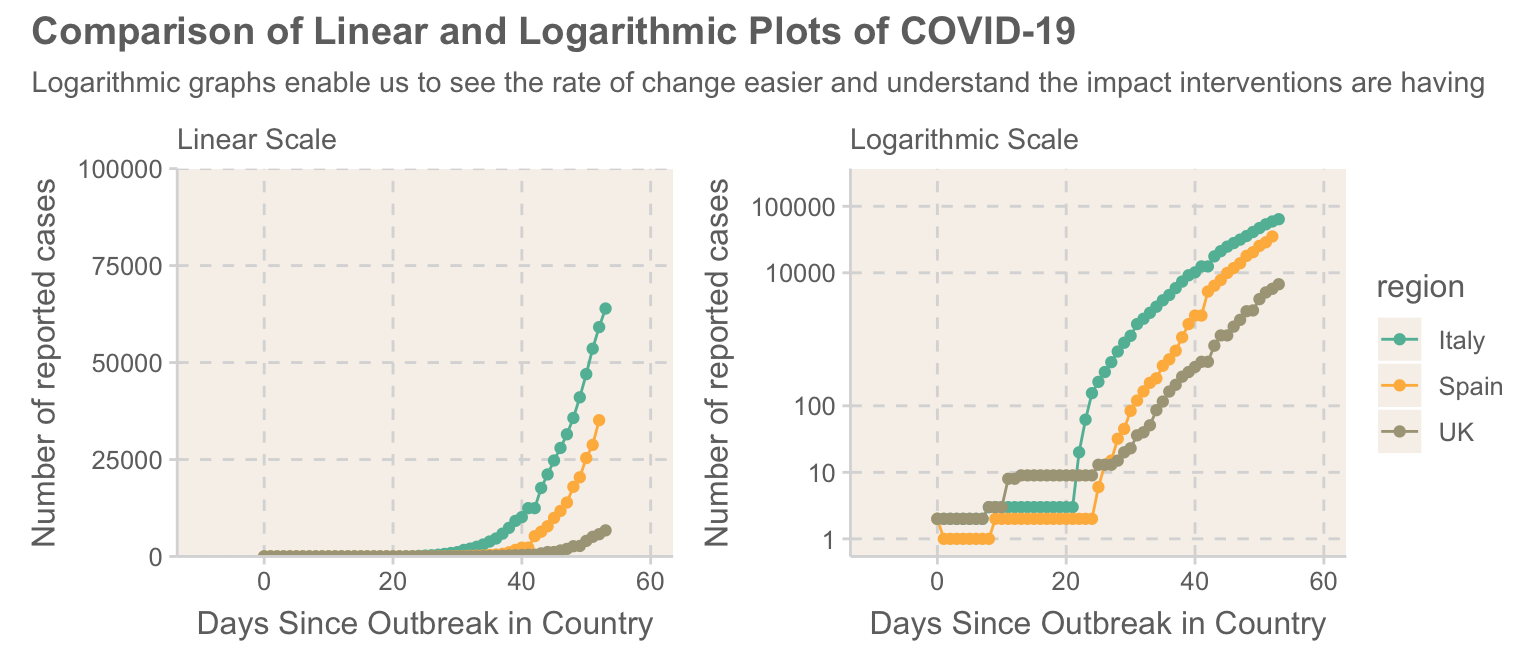
UK goes into lockdown: further Covid-19 analysis
As more countries find themselves challenging the growth of Covid-19, we explore the data behind the outbreak to see the trajectories that countries are taking.
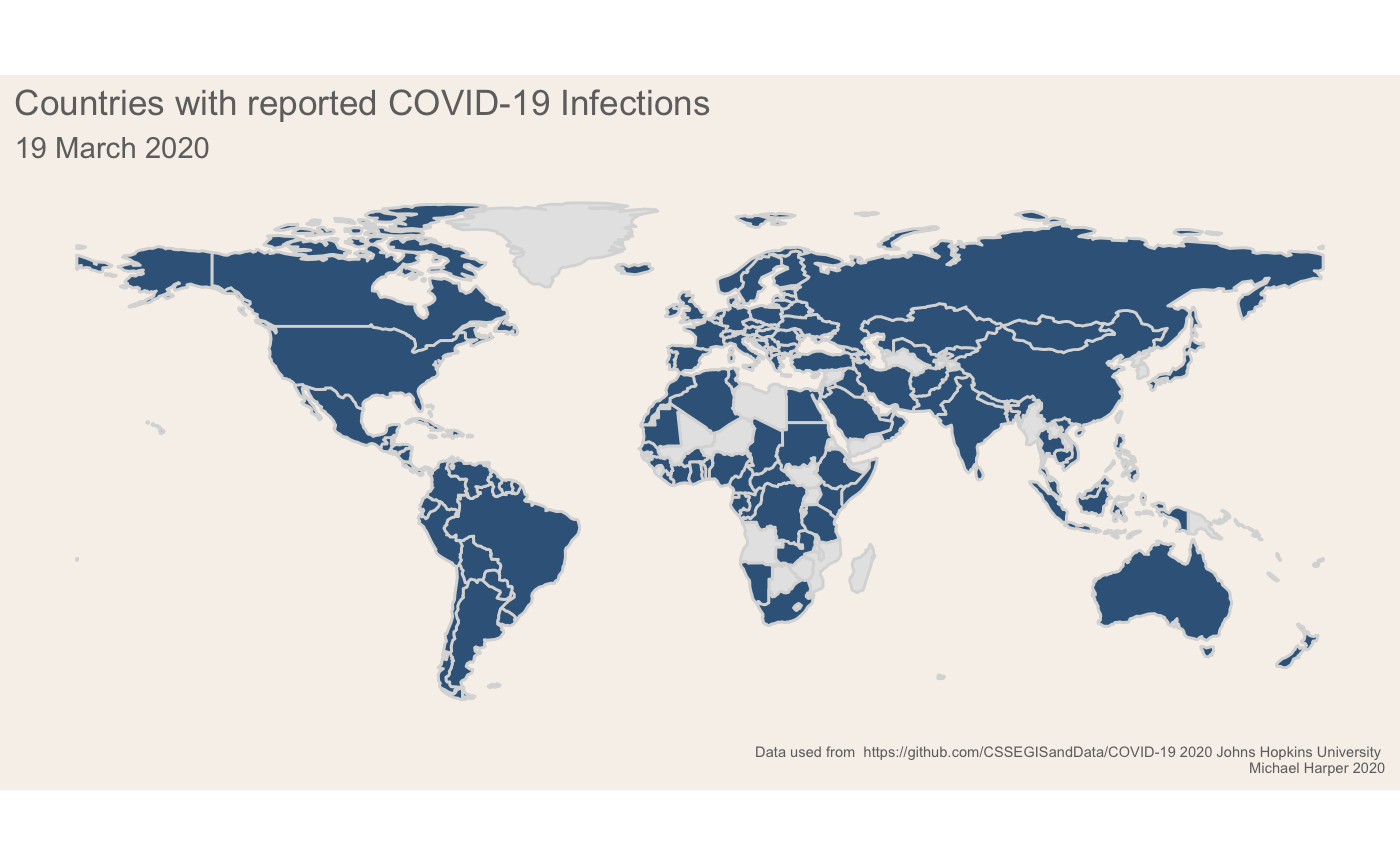
Visualising Covid-19 With Animated, Static and Interactive Maps
Code to show the global spread of Covid-19
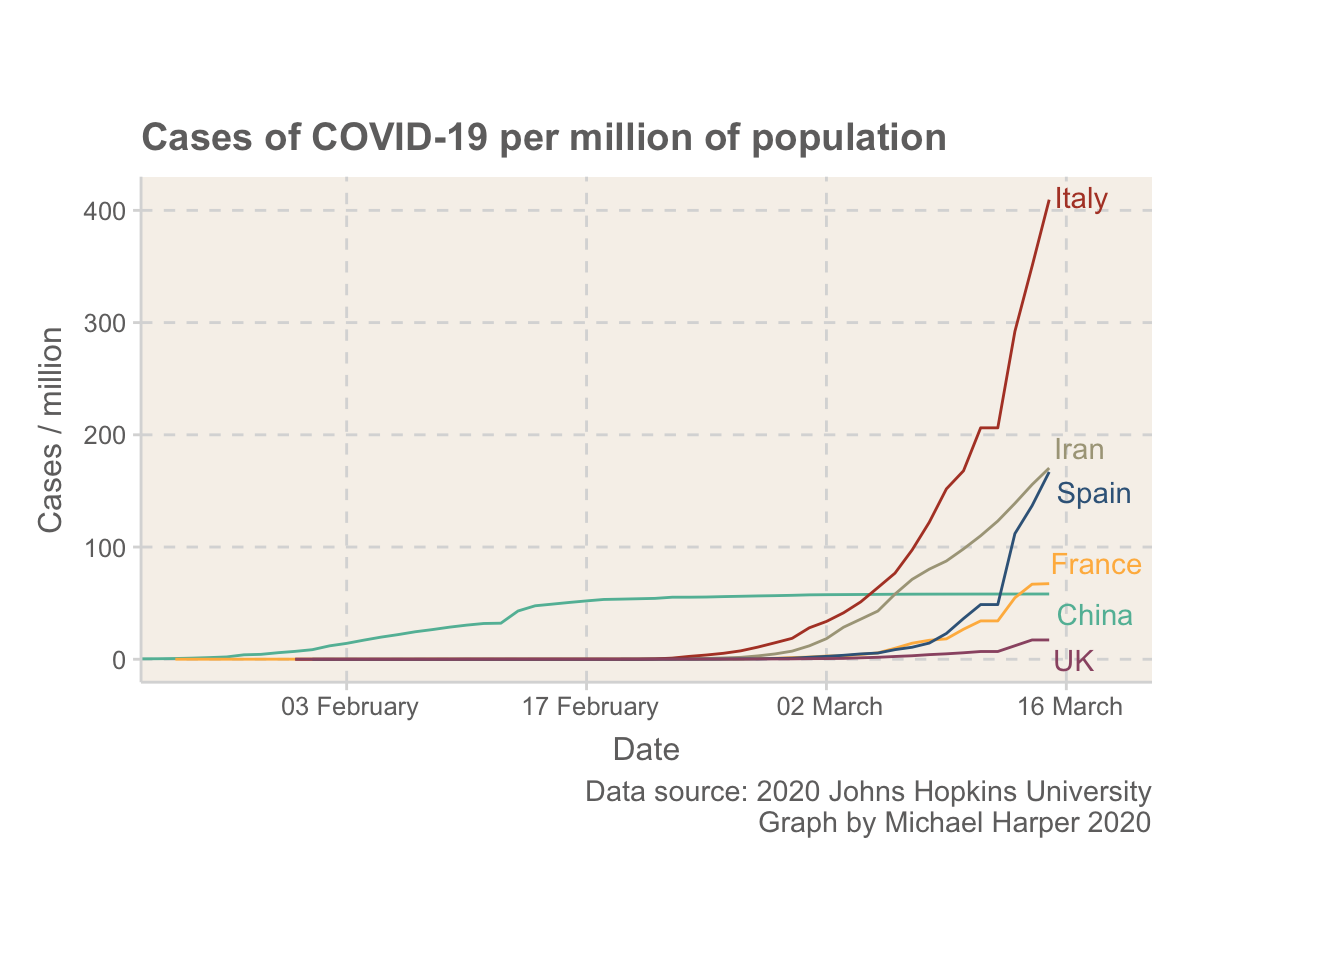
COVID-19 Preliminary Data Analysis
Some Preliminary data analysis into COVID-19

Things I learnt at rstudio::conf 2019
My reflection rstudio::conf 2019 and all the packages discovered
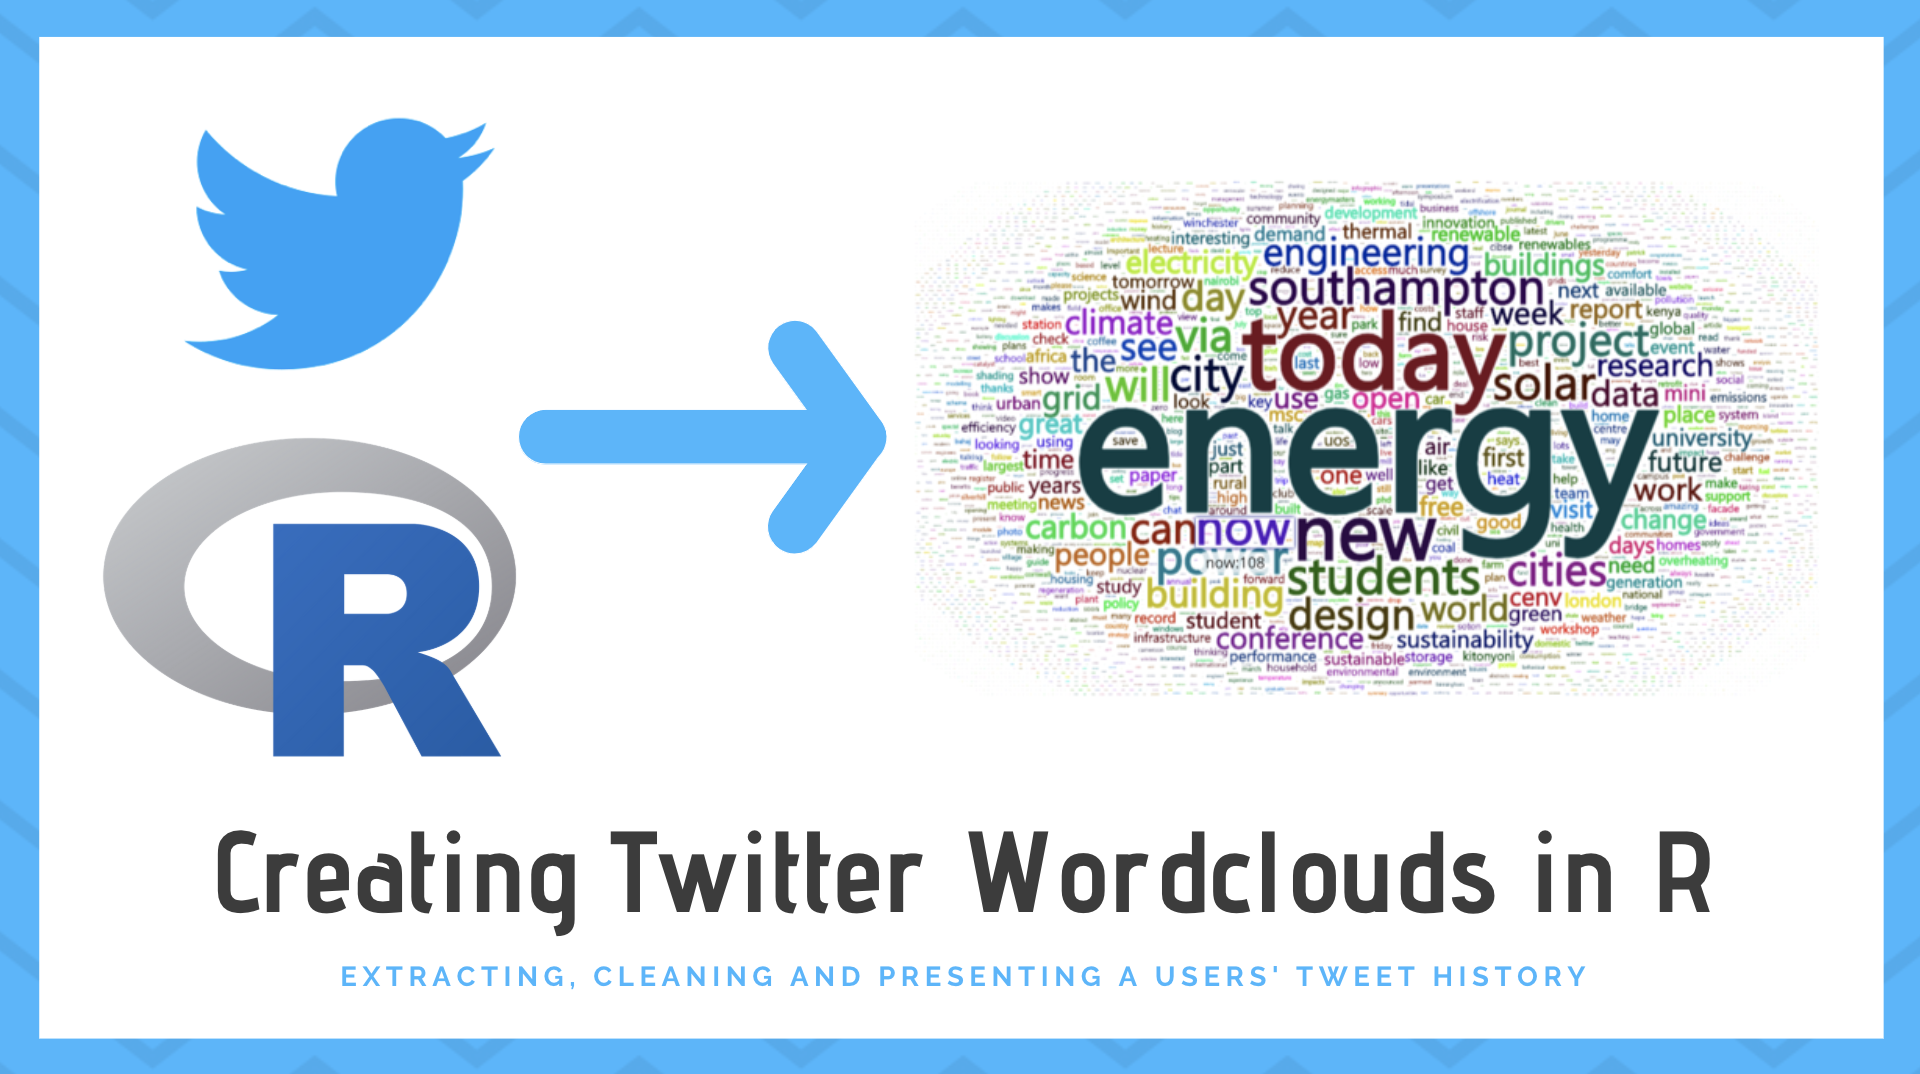
Creating Twitter Wordclouds in R
A guide on creating wordclouds using the rtweet package in R.
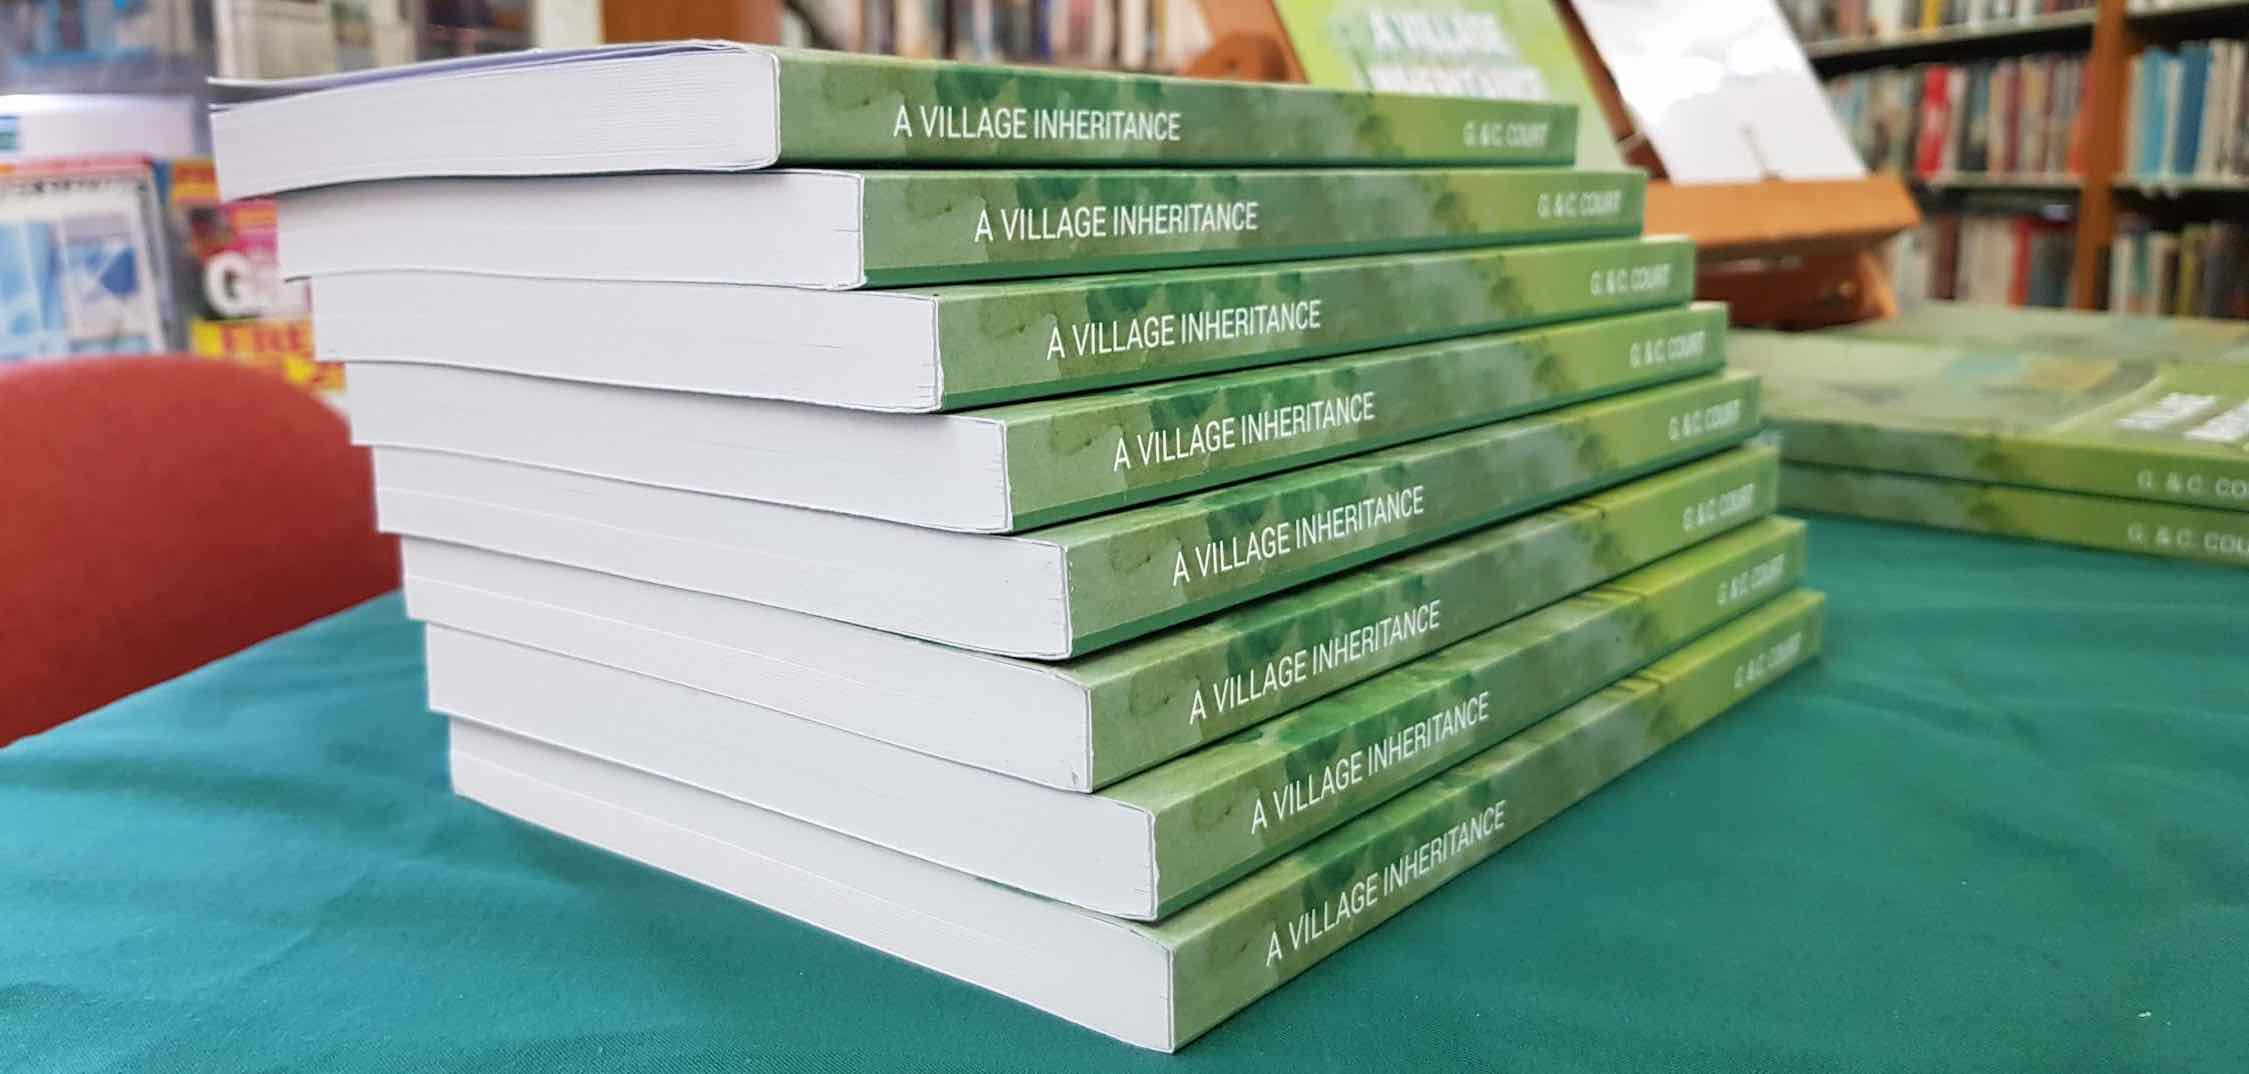
Book Launch of "A Village Inheritance"
Back in 2014, I discovered a beaten old manuscript written by my grandparents back in the 1973. Today, after smany hours we officially launched the finished book!
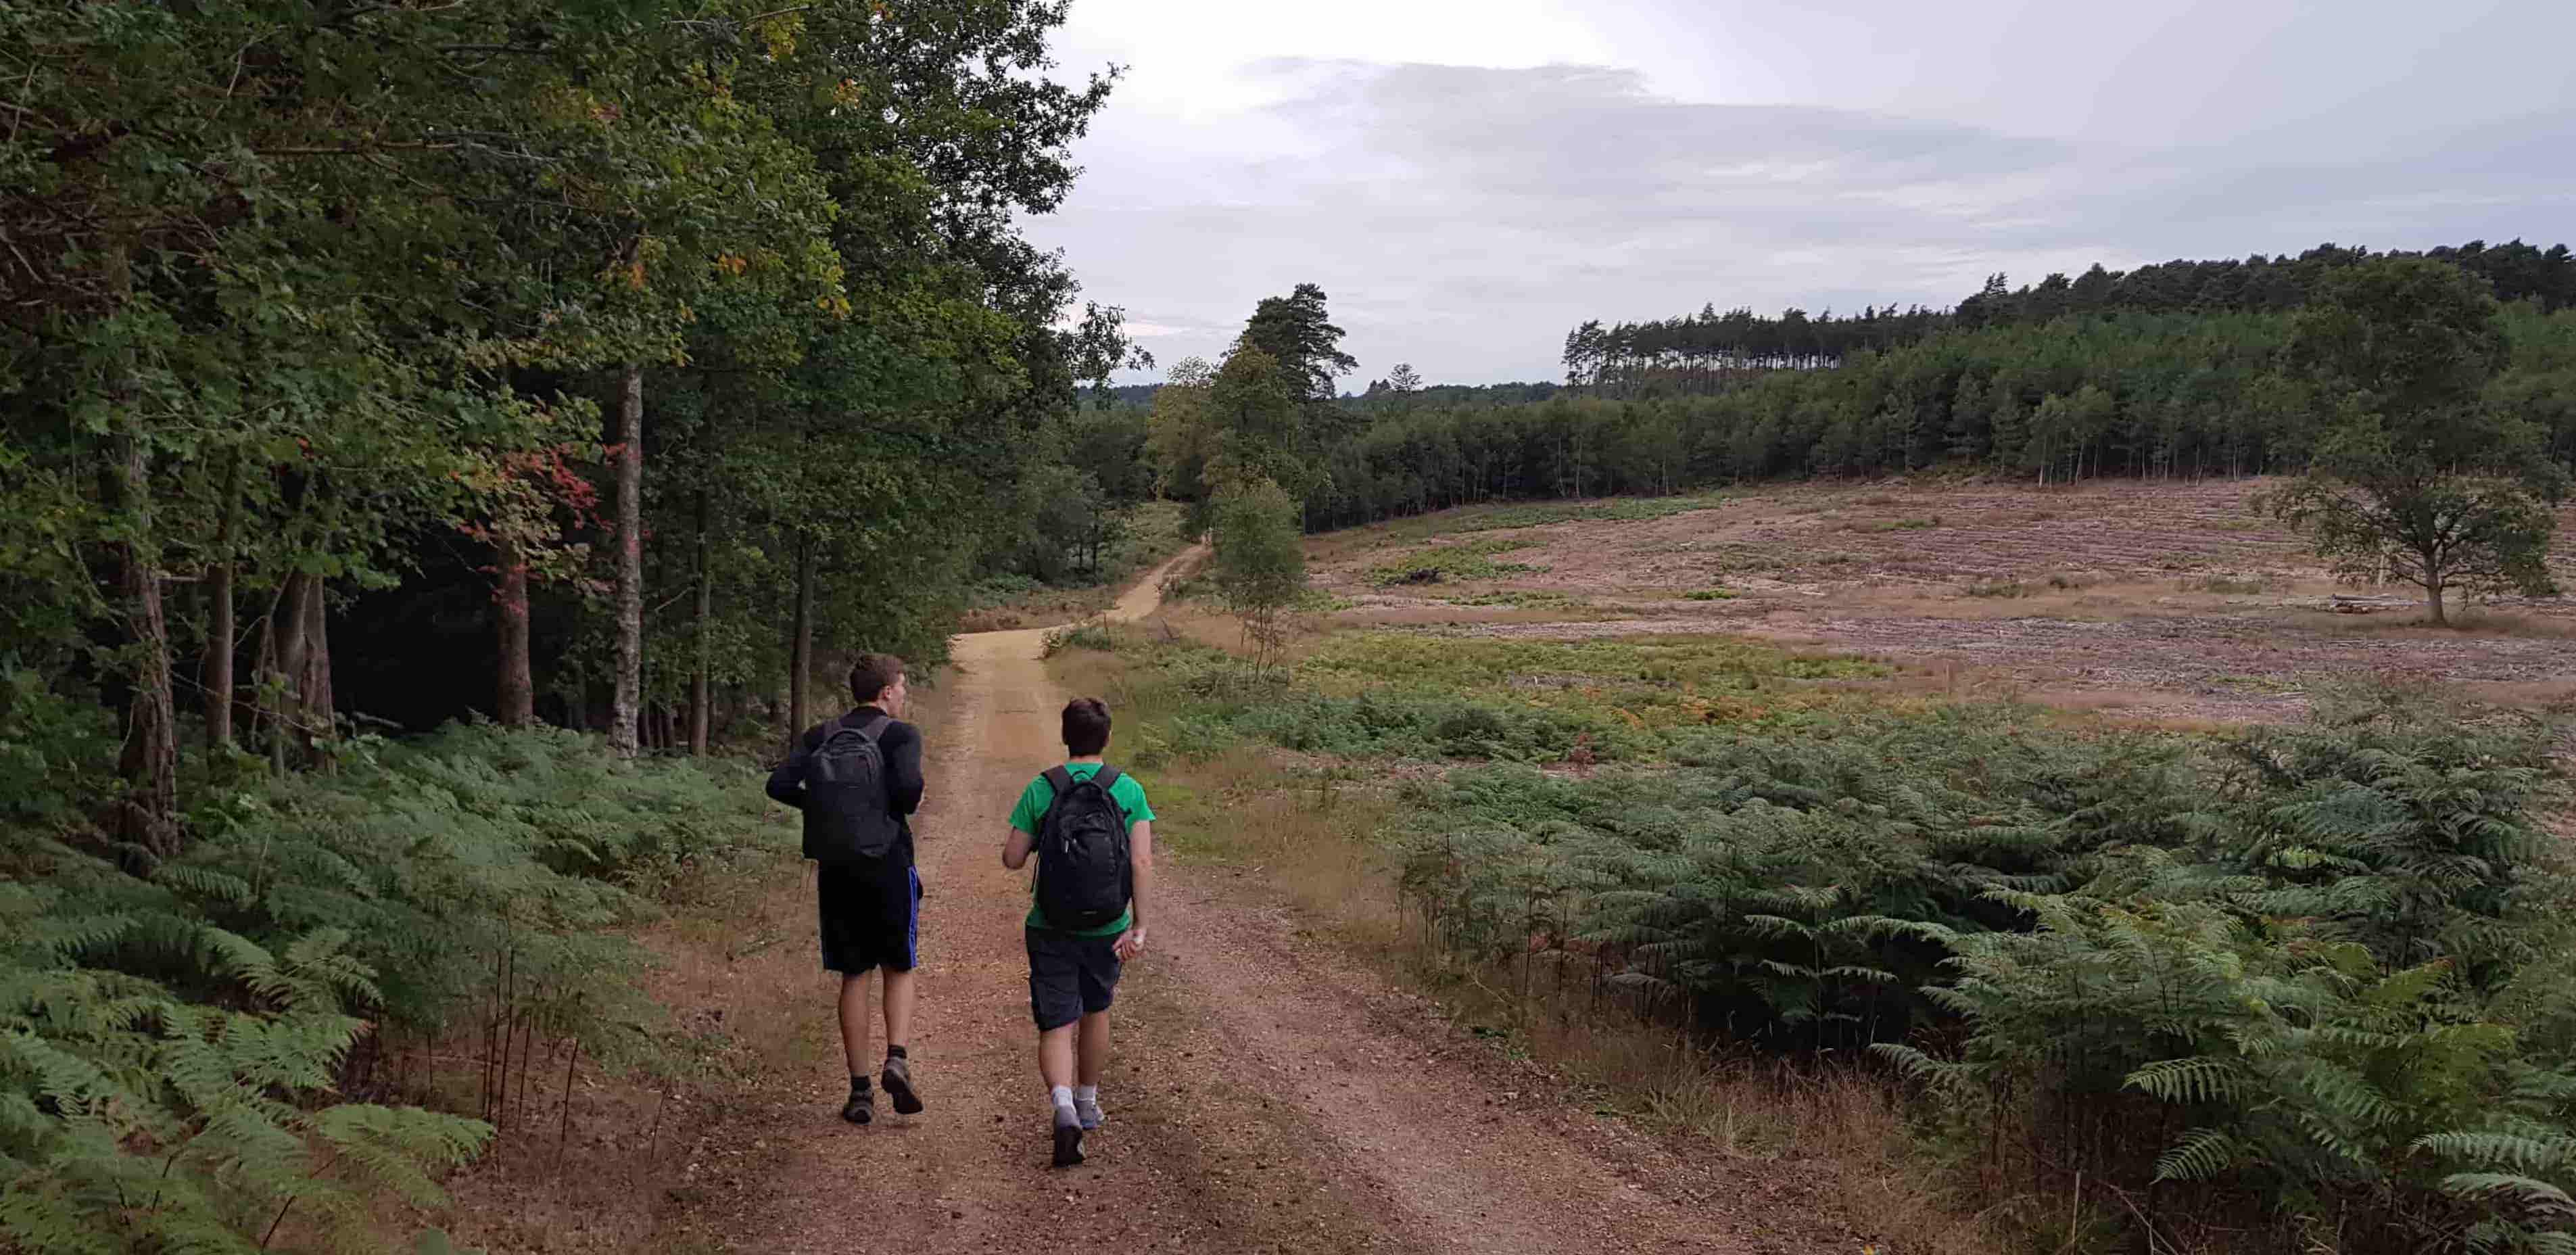
Walking from London to Basingstoke
18 hours, 50 miles, some fun and lots of pain. A write up on how the day went, and a lesson on just because you say you will do something, it doesn't necessarily mean you should.
Animated Plots with R
Some examples of using animated plots with geospatial data.
Data-driven flowcharts in R using DiagrammeR
A short introduction on how to use R to produce data-driven flowcharts.

Migrating blog to Blogdown
Mapping UK Local Political Data
For my PhD research, I needed to collect local political data for the UK. This article documents the data sources and procedure used to create a suitable dataset for my analysis, and allows for the analysis to be easily reproduced for use within your own workflow/
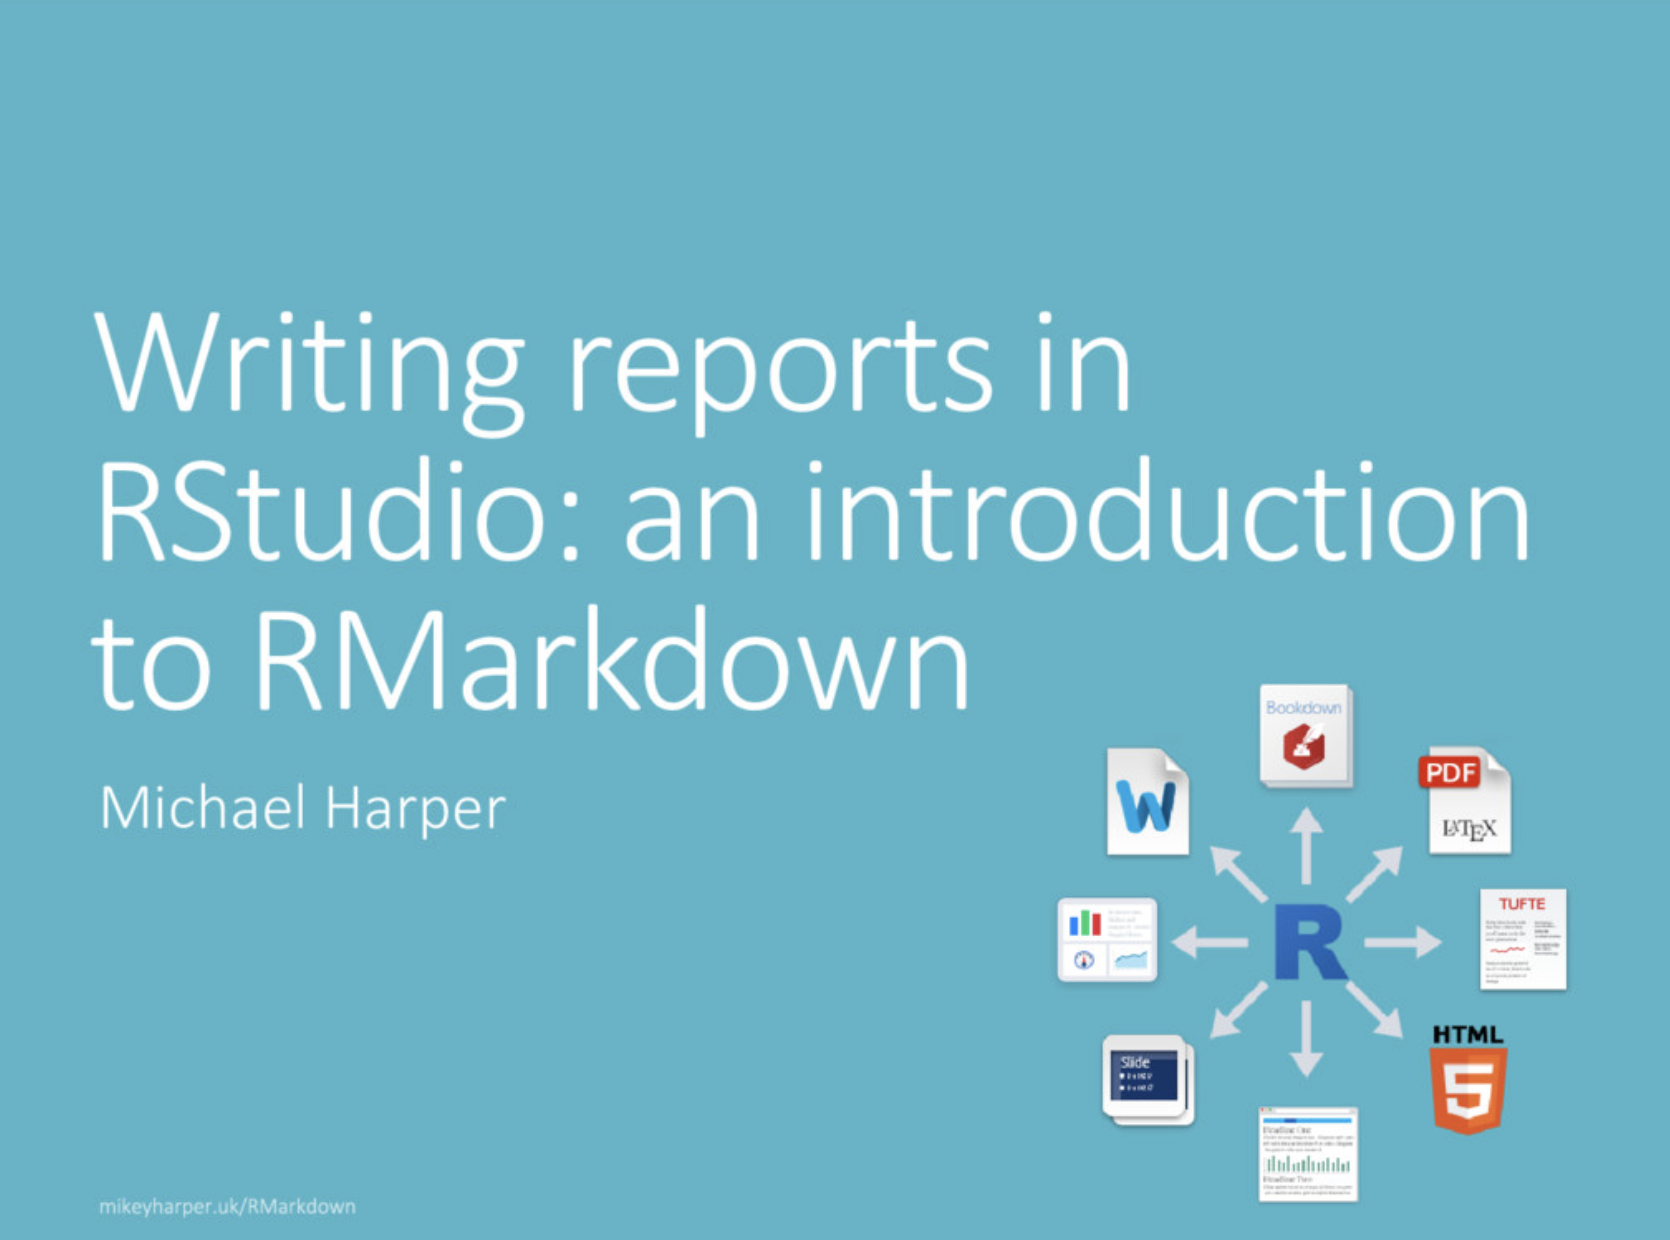
Writing reports in RStudio: an introduction to RMarkdown
Learn why you should consider the benefits of RMarkdown for doing data-driven research. This post shares a presentation which I gave to the Spatial Modelling group, and provides some useful resources for futher reading.
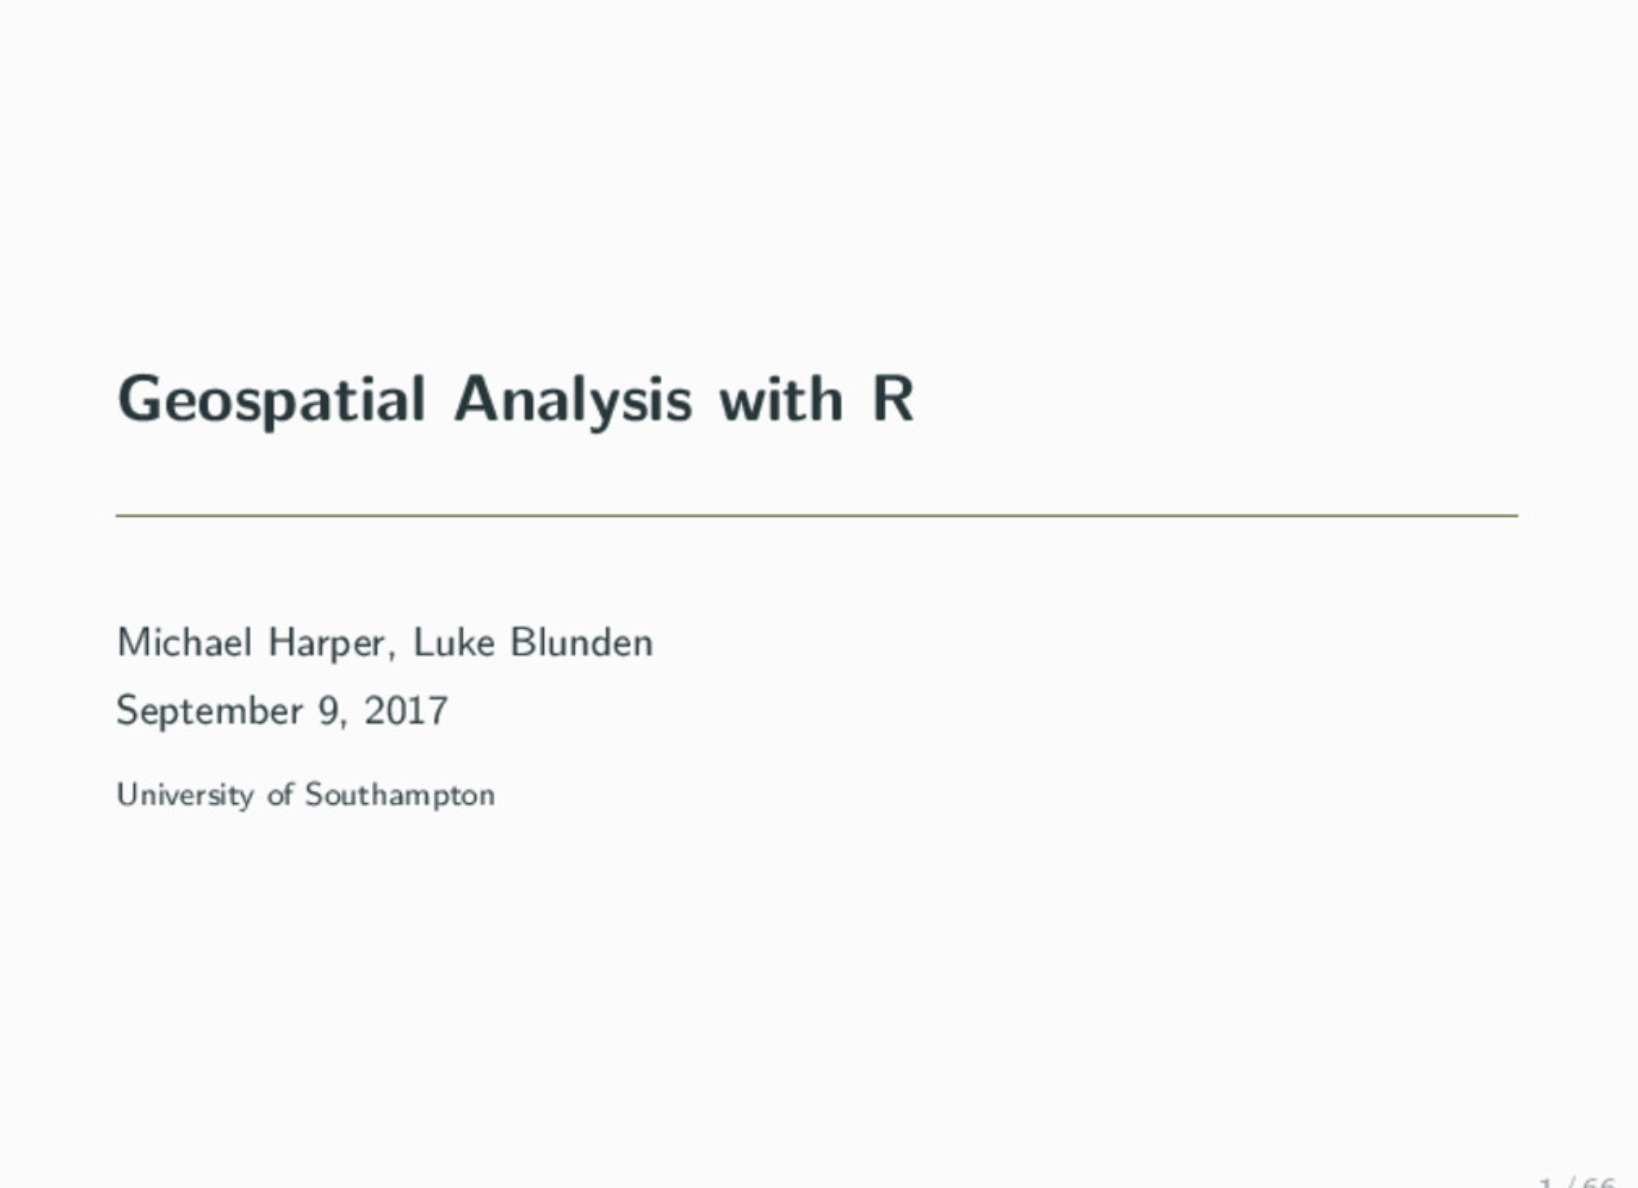
Using R for Geospatial Data Analysis
Although R is widely used for data processing and statistical modelling, it is less frequently known for its powers of handing Geospatial Data. This presentation is aimed to show people the benefits of using R in their analyses, and provides practical guidance on how to get started on your first project.
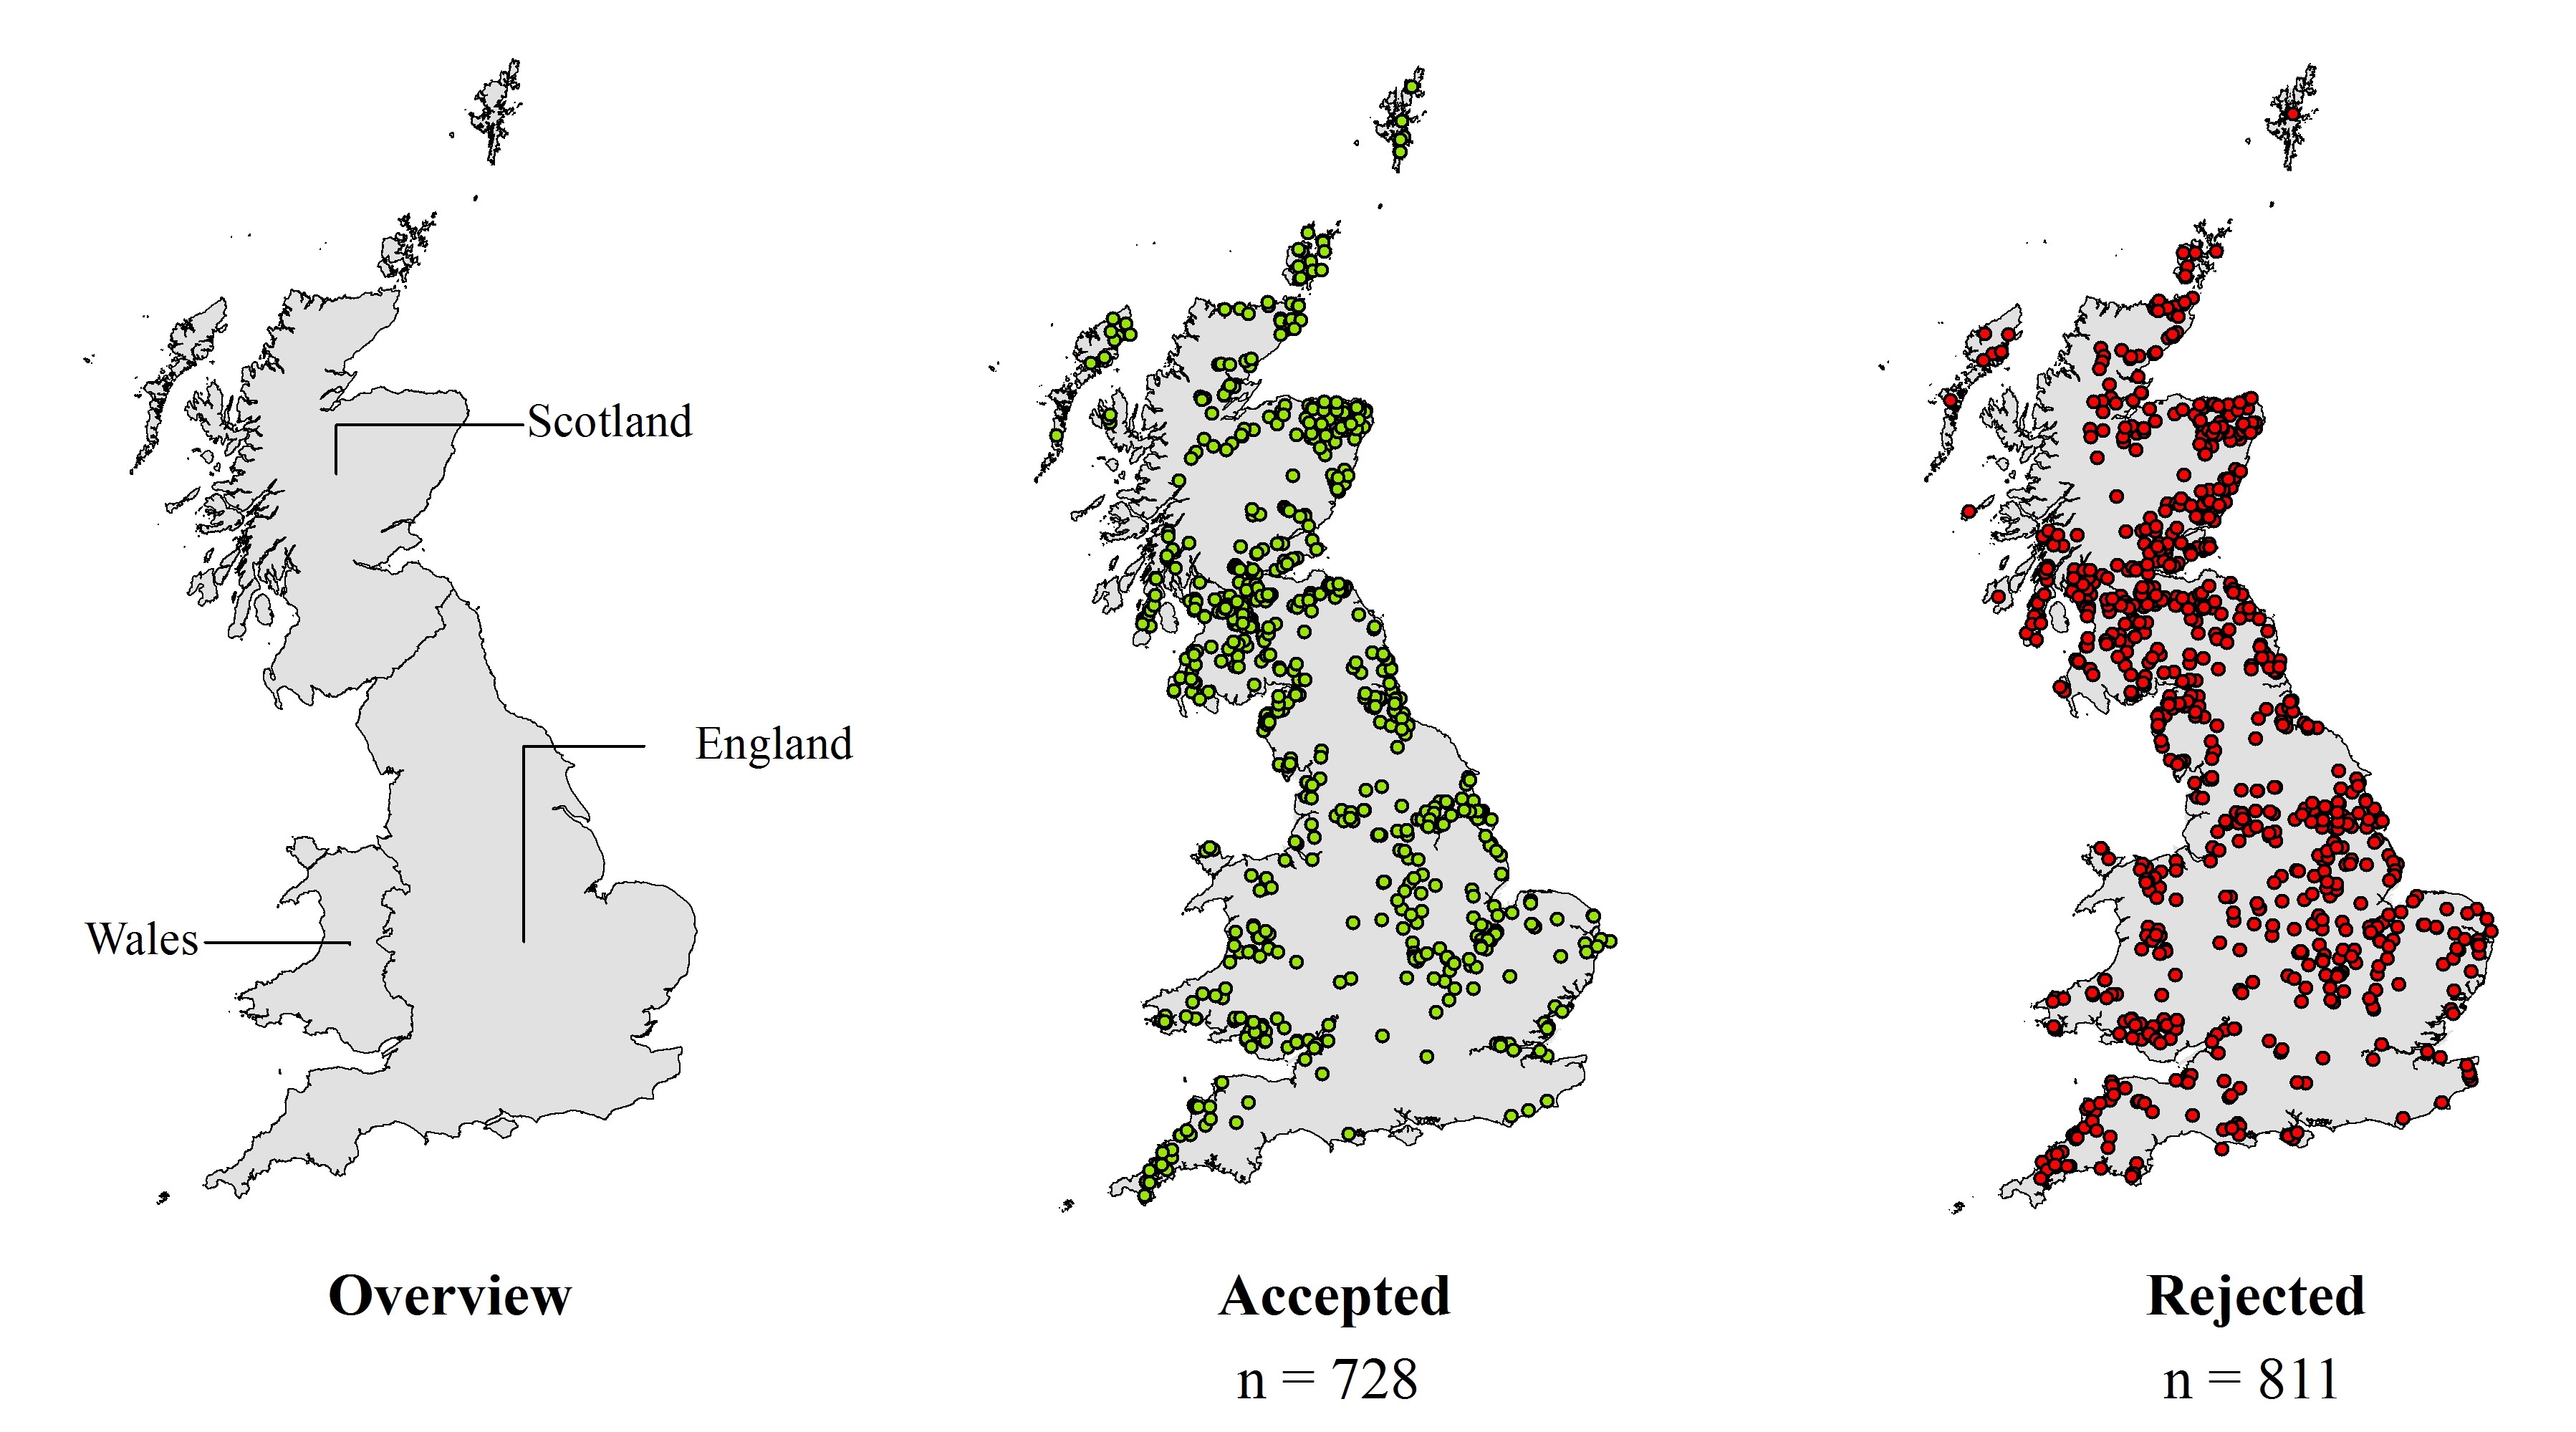
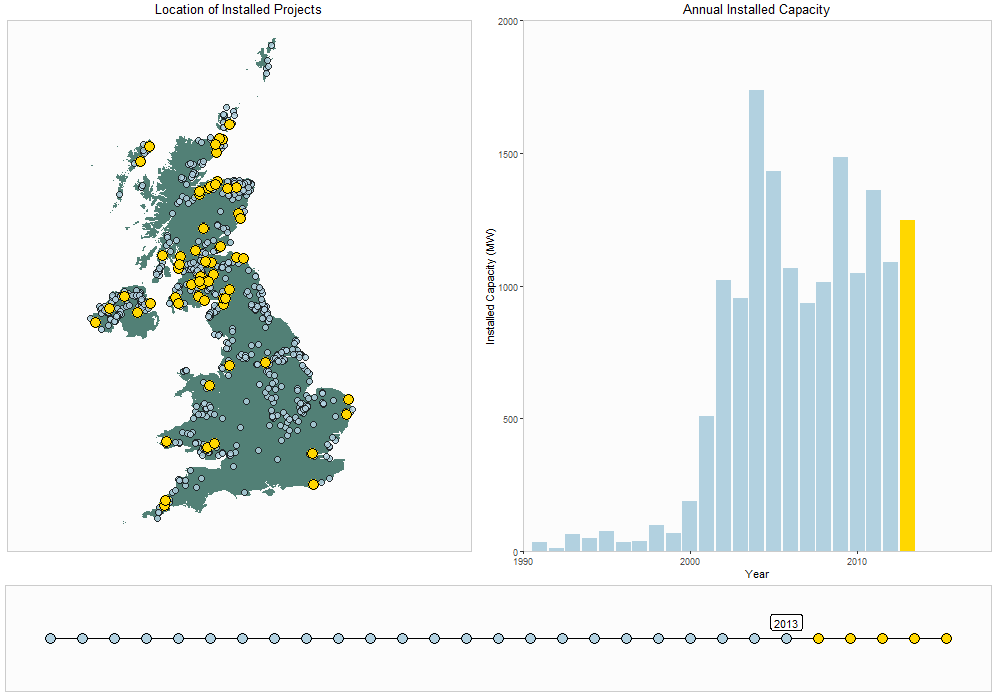
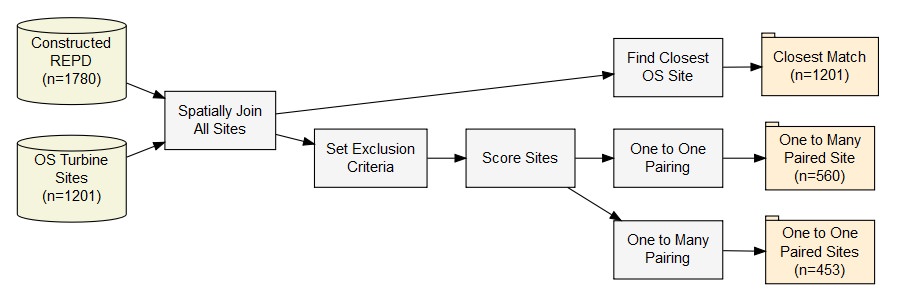
Identifying key influences for planning acceptance of onshore wind turbines
Conference paper presented at ECOS 2017 on my research into understanding why some wind farms are more successful than others.
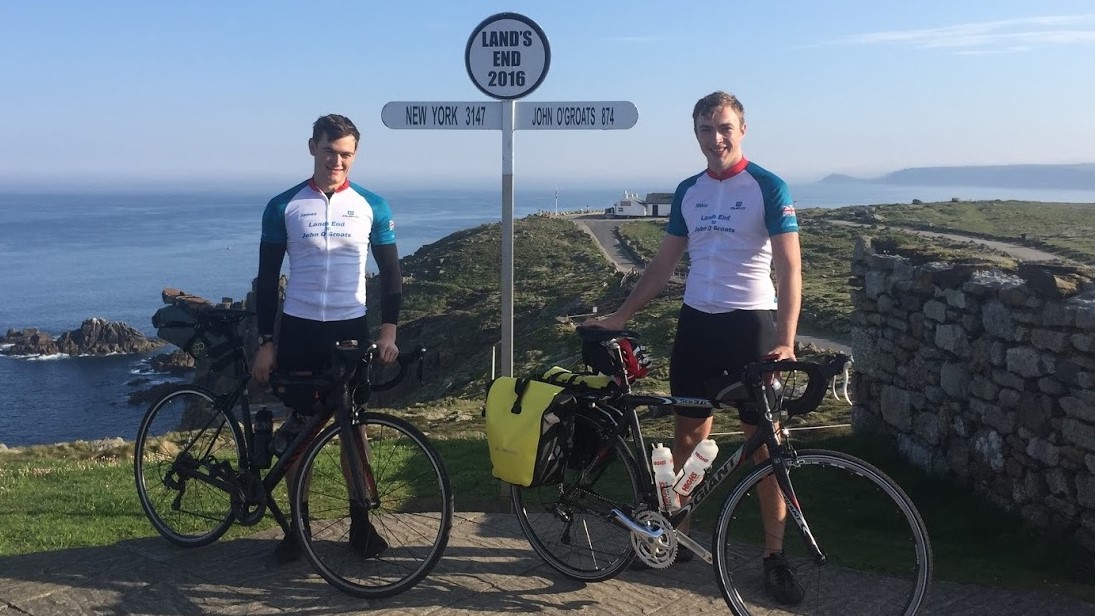
Cycling Lands End to John O'Groats
Back in May 2016, a friend and I undertook one of the challenges which we had wanted to do for years and cycled the length of the United Kingdom from Land's End to John O' Groats. It was a fantastic experience and something I would love to do again one day. This blog provides a summary of our trip and aims to aid anyone who may be planning their own trip.