Building a CO2 Energy Sensor
What else better to do over the weekend than to come up new smart home devices! And this is exactly what I have done, building a light which provides me an update on the current carbon intensity of the electricity supply. I am quite happy with the end result, and this blog explains the motivation behind the idea, along with code for anyone who wants to replicate it. I hope it helps!
The Challenge: Varying CO2 Emmissions
As we shift increasingly to using renewable energy resources, there becomes an increasing issue of not only how much electricity needs to be produced, but importantly when.
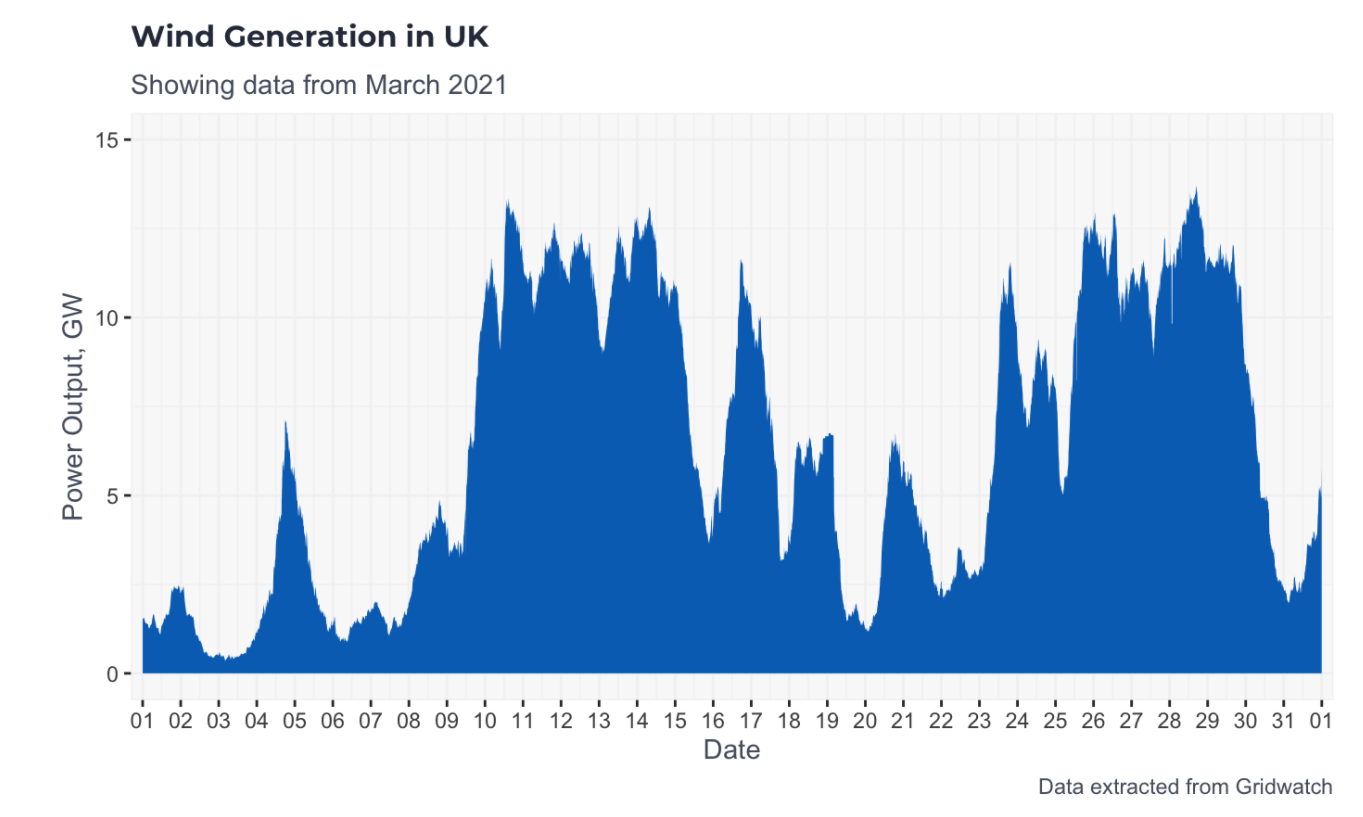
Renewable energy like solar and wind operate very differently to “traditional” power stations such as coal and gas. There is much less control over exactly when they will produce energy and how much will be produced. This is highlighted below, showing the UK’s wind generation for March 2021. At its peak, wind was providing 13GW of electricity, which is enough energy to power 13 million homes! However, just a few days earlier, the output had been only a few GW.
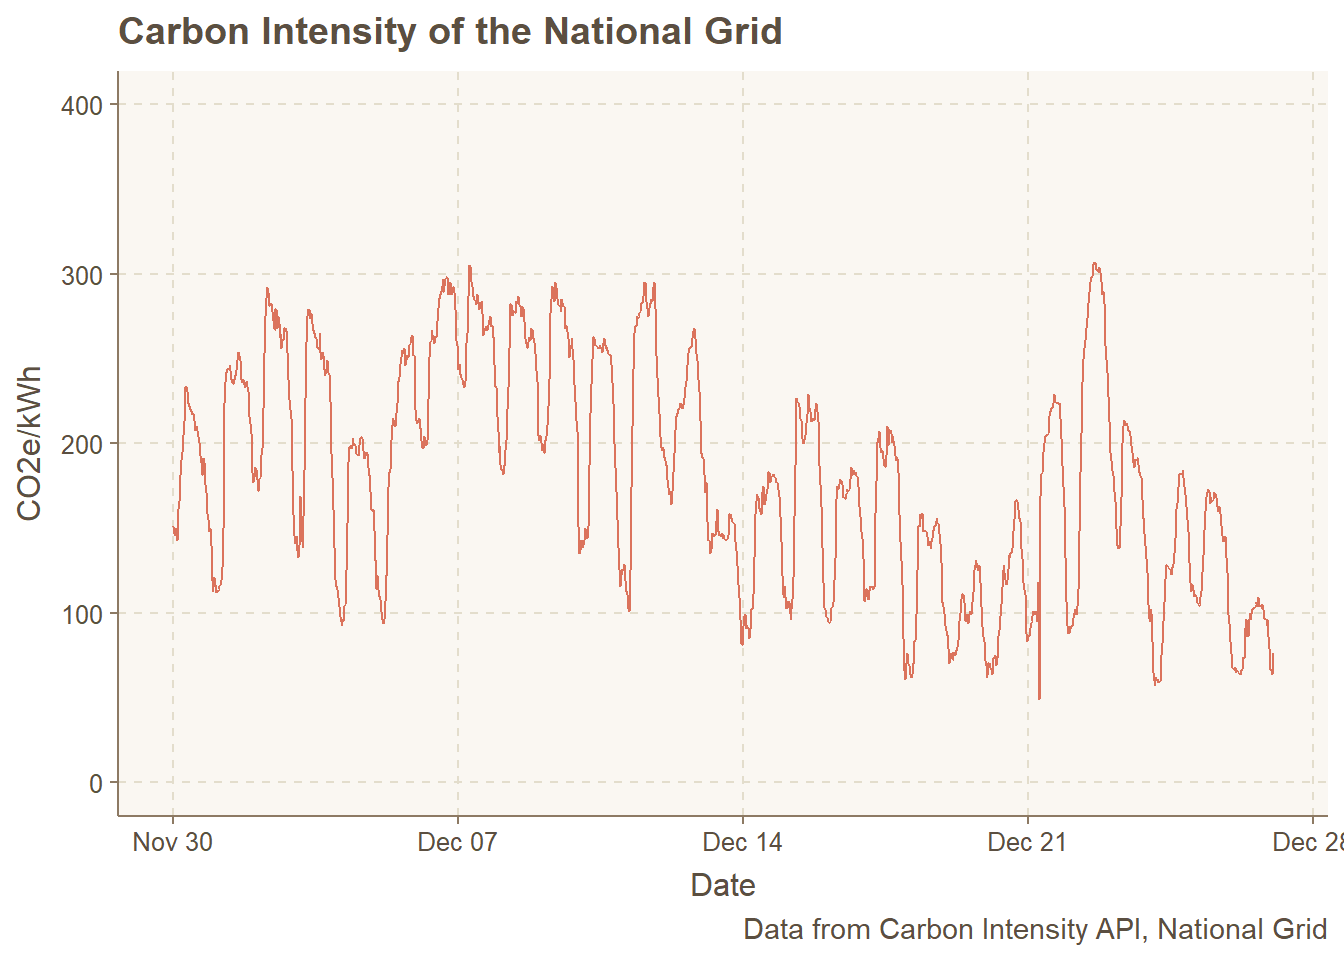
As a result of such large variations, the carbon intensity of the grid changes. When there is a lot of renewable energy available, the intensity is low, but if the sun isn’t shining, or wind isn’t blowing, then the carbon intensity is generally higher.
The figure below shows the Carbon intensity of the national grid over the past month.
The Idea
There are a few resources out there which inform users of potential carbon emissions from their consumption. For example:
However, part of the problem with these approaches is they mostly rely on you opening an app or visiting a website. Sure, this might work for technical enthusiast like myself, but will it really work for people such as my wife? My feeling with this project was that occupants of houses want to have a minimum tolerance for changing their behaviour: if they want to put the dishwasher on, they are very unlikely to want to go out of their way, check a graph and make a decision about when to run it. What we need is a simple visual prompt for people to be able to make a decision.
So I came up with a basic side lamp idea, which could provide a visual cue to people. This can sit relatively unobtrusively, but equally is relatively easy to get an understanding of the current CO2 outputs. If you see red or yellow, it should hopefully make you think twice of whether you need to use the electricity now, or whether it could be deferred to another time!
The Setup
There are three main components to this project:
- The data
- The hardware: ESP Home
- Linking them up with Home Assistant
Note, this tutorial is very Home Assistant focussed. It would probably be achievable coding this all in native Arduino code, so the solution might look a bit messy. But if like me you are competent in the tools above and don’t want to learn extra code innecessarily, this should help!
The data stream
Firstly, we need a reliable and up-to-date dataset which provides us with the carbon emissions for the UK. For where I am based in the United Kingdom, two options for this:
- co2signal: offers a Home Assistant integration. This provides data for most of Europe, and many other parts of the world. The Electricity map gives you a good place to check. You’ll need an account to use this, but have a free tier.
- Carbon Intensity API this project is specifically for the UK, but offers a free API which gives carbon estimates. It also goes down a regional level if needed, although I didn’t use this for this work.
Both these methodologies offer slightly different carbon emissions, as they have to calculate this themselves, however they are similar enough to not worry about. I ultimately decided to use the Carbon Intensity API. It offered a more extensive suite of APIs, and there was no limit on the calls made: I found that the co2signal would occasionally rate limit my calls resulting in an error. However, as Carbon Intensity offers no official integration, I instead decided to do the API calls instead.
I came up with the following code for querying the API and bringing the data into Home Assistant. The code does a single API call every 1800 seconds (30 minutes). Template sensors are then used to extract the required values from the full JSON objet returned from the API call, which creates the sensors sensor.carbon_intensity_value, the gCO2e/kWh expressed as a numeric value, and sensor.carbon_intensity_index, a rating of the CO2 score, expressed from very low, low, moderate and high and very high. You can add this to your sensors.yaml within you Home Assistant configuration:
# Carbon Intensity for UK: Headline Figure - platform: rest name: Carbon Intensity Full resource: https://api.carbonintensity.org.uk/intensity json_attributes: data scan_interval: 1800 - platform: template sensors: carbon_intensity_value: friendly_name: 'Carbon Intensity Value' value_template: '{{ state_attr("sensor.carbon_intensity_full", "data")[0].intensity.actual}}' icon_template: 'mdi:molecule-co2' unit_of_measurement: "CO2e/kWh" carbon_intensity_index: friendly_name: 'Carbon Intensity Index' value_template: '{{ state_attr("sensor.carbon_intensity_full", "data")[0].intensity.index}}'The Hardware
For my light, I used ESPHome, which is one of the best Home Assistant integrations available for building Arduino based sensors. Instead of having to write the Arduino code yourself, you can instead focus on writing relatively simple YAML files which enable us to build some basic logic around.
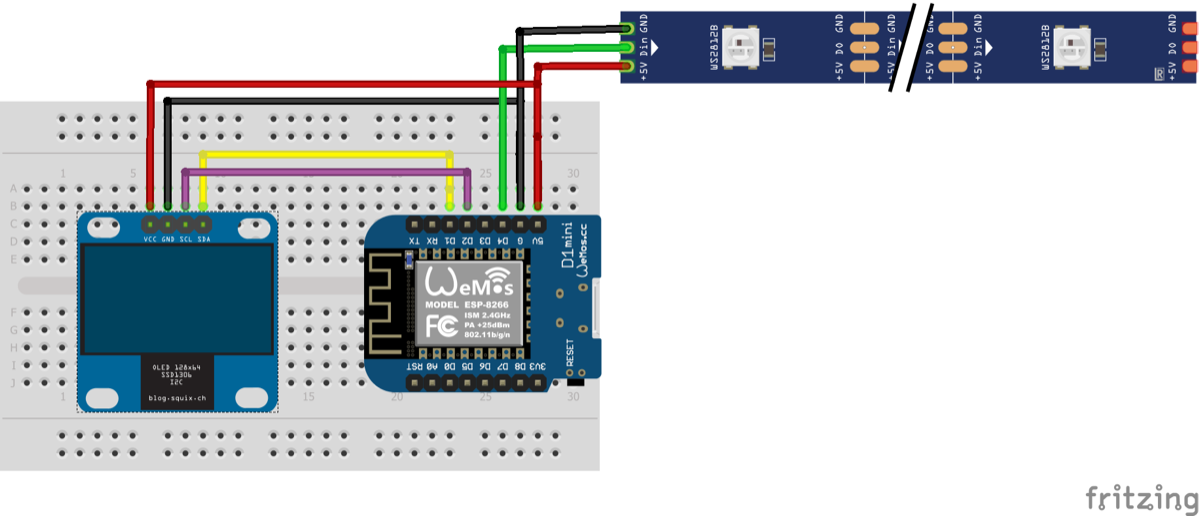
For the setup here, I only have three components:
- The ESP8266 chip. I use a Wemo D1 mini here [link to AliExpress]
- The addressible LEDs: WS2812B are my go-to for any LEDs, but there is no real need for the addressible LEDs in this project [link to AliExpress]
- The Display [link to AliExpress]
- Some container: I had a light bulb drinking cup knocking around which seemed like the perfect object!
The following code sets up the code. Note, that a lot of the code is for the display.
esphome:  name: carbonintensity  platform: ESP8266  board: d1_mini
wifi:  ssid: !secret SSID  password: !secret SSIDPassword
captive_portal:
# Enable logginglogger:
# Enable Home Assistant APIapi:
ota:

light:  - platform: fastled_clockless    chipset: WS2812B    pin: D4    num_leds: 4    rgb_order: GRB    name: "FastLED WS2811 Light"    id: "CarbonIntensity"
# Code for displaysensor:  - platform: homeassistant    name: "Grid CO2 Sensor From Home Assistant"    entity_id: sensor.carbon_intensity_value    id: co2intensity    internal: True
text_sensor:  - platform: homeassistant    name: "CO2 Rating"    entity_id: sensor.carbon_intensity_index    id: co2label    internal: True
# Example configuration entryi2c:  sda: D1  scl: D2  scan: False
font:  - file: "Roboto.ttf"    id: my_font    size: 25
  - file: "Roboto.ttf"    id: my_font_2    size: 12
display:  - platform: ssd1306_i2c    model: "SH1106 128x64"    reset_pin: D0    address: 0x3C    lambda: |-      // Print inside temperature (from homeassistant sensor)        it.printf(60, 30, id(my_font), TextAlign::BASELINE_RIGHT , "%.0f", id(co2intensity).state);        it.printf(60, 30, id(my_font_2), TextAlign::BASELINE_LEFT , "g CO2e kwh");        it.printf(60, 60, id(my_font_2), TextAlign::BASELINE_CENTER, "Rating: %s", id(co2label).state.c_str());
You’ll note several things from the above: firstly, the device extracts the data from Home Assistant, and secondly, there is no logic controlling the colour of the light with ESPHome. It would probably be possible for the Wemo D1 to manage both of these, but the design ethos for ESPHome is that the majority of the thinking is done by the Home Assistant device itself.
Automating the Light changes
We have two options for making the light change colour.
Changing Colour based on value
alias: Carbon Intensity Bulb Updatedescription: ''trigger: - platform: state entity_id: sensor.carbon_intensity_valuecondition: []action: - service: light.turn_on data_template: entity_id: light.fastled_ws2811_light hs_color: > {% if states('sensor.carbon_intensity_value') == 'unavailable'%}[300,100] {% elif states('sensor.carbon_intensity_value') | float < 300 %} [ {{ (-0.45 * states('sensor.carbon_intensity_value')|int + 135)|int }} , 100 ] {%else%}[1,100] {% endif %}mode: singleChange Colour Based on Category
As mentioned earlier, the Carbon Intensity API provides us with an index which scores the colour. We can instead use this to assign the colour. A benefit of this is that it makes it easier to set unique colours which stand out for the categories, but we will lose the smooth colour gradients across the groups. Ultimately this was my preferred route so it is what I used.
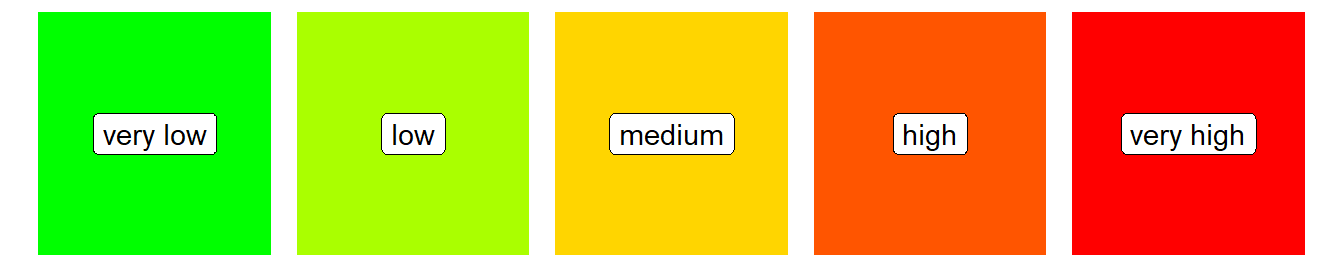
service: light.turn_ondata_template: entity_id: light.fastled_ws2811_light hs_color: > {% if states('sensor.carbon_intensity_index') == 'very low' %}[120,100] {% elif states('sensor.carbon_intensity_index') == 'low' %}[80,100] {% elif states('sensor.carbon_intensity_index') == 'moderate' %}[50,100] {% elif states('sensor.carbon_intensity_index') == 'high' %}[20,100] {% elif states('sensor.carbon_intensity_index') == 'very high' %}[0,100] {%else%}[300,100] {% endif %}Potential Improvements
As shown in the apps,