East/West patterns in Covid-19: validating claims of correlation
Recent analysis came out claiming that there was evidence of a East to West pattern of Covid impacts for Europe. The purpose of this article is to provide a statistical review of the claims made, and to help provide a clearer explanation around the work.
If this article looks long and overly detailed, that is the very point. I want to explain the decisions along the way which are being made and will aim to be as objective as possible, and to do so in a way which is hopefully not too intimidating if you aren’t overly familiar with statistical analysis.
As a final reminder, I am not here to knock Joel! Kudos to him for questioning and exploring data. I admire that people want to explore evidence and understand Covid, and as people flag, science is about asking questions. But science is also about peer review, and this article is designed to provide some important feedback and consideration for the conclusions reached in the original work. I raise genuine concerns around the interpretations reached by Joel, and hope that amendments can be made to his original conclusions.
Summary of findings
- The pattern of Covid-related deaths for Europe do show a general separation from East to West, although with notable outliers (Portugal). This is backed up with some additional statistical analysis.
- Although the work by Joel provides empirical examples of his relationship, no statistical analysis is conducted beyond the visual clustering, and therefore claims of correlation between geography and Covid-19 deaths cannot be substantiated.
- The conclusion that lockdown stringency having no impacts seem to be based on the assumption that most countries have followed similar measures yet have different seasonal profiles. Additional statistical analysis highlights that the stringency of lockdown is strongly associated with the Covid patterns. Countries which experience no spike in April entered lockdown when fewer deaths had been encountered to Covid compared to those which had large spikes.
- Although the exploratory data analysis is interesting, I would suggest that revisions are made to the original claims in light of the findings of this review.
What does the original study claims
So, let’s start with the original claims from this Tweet:
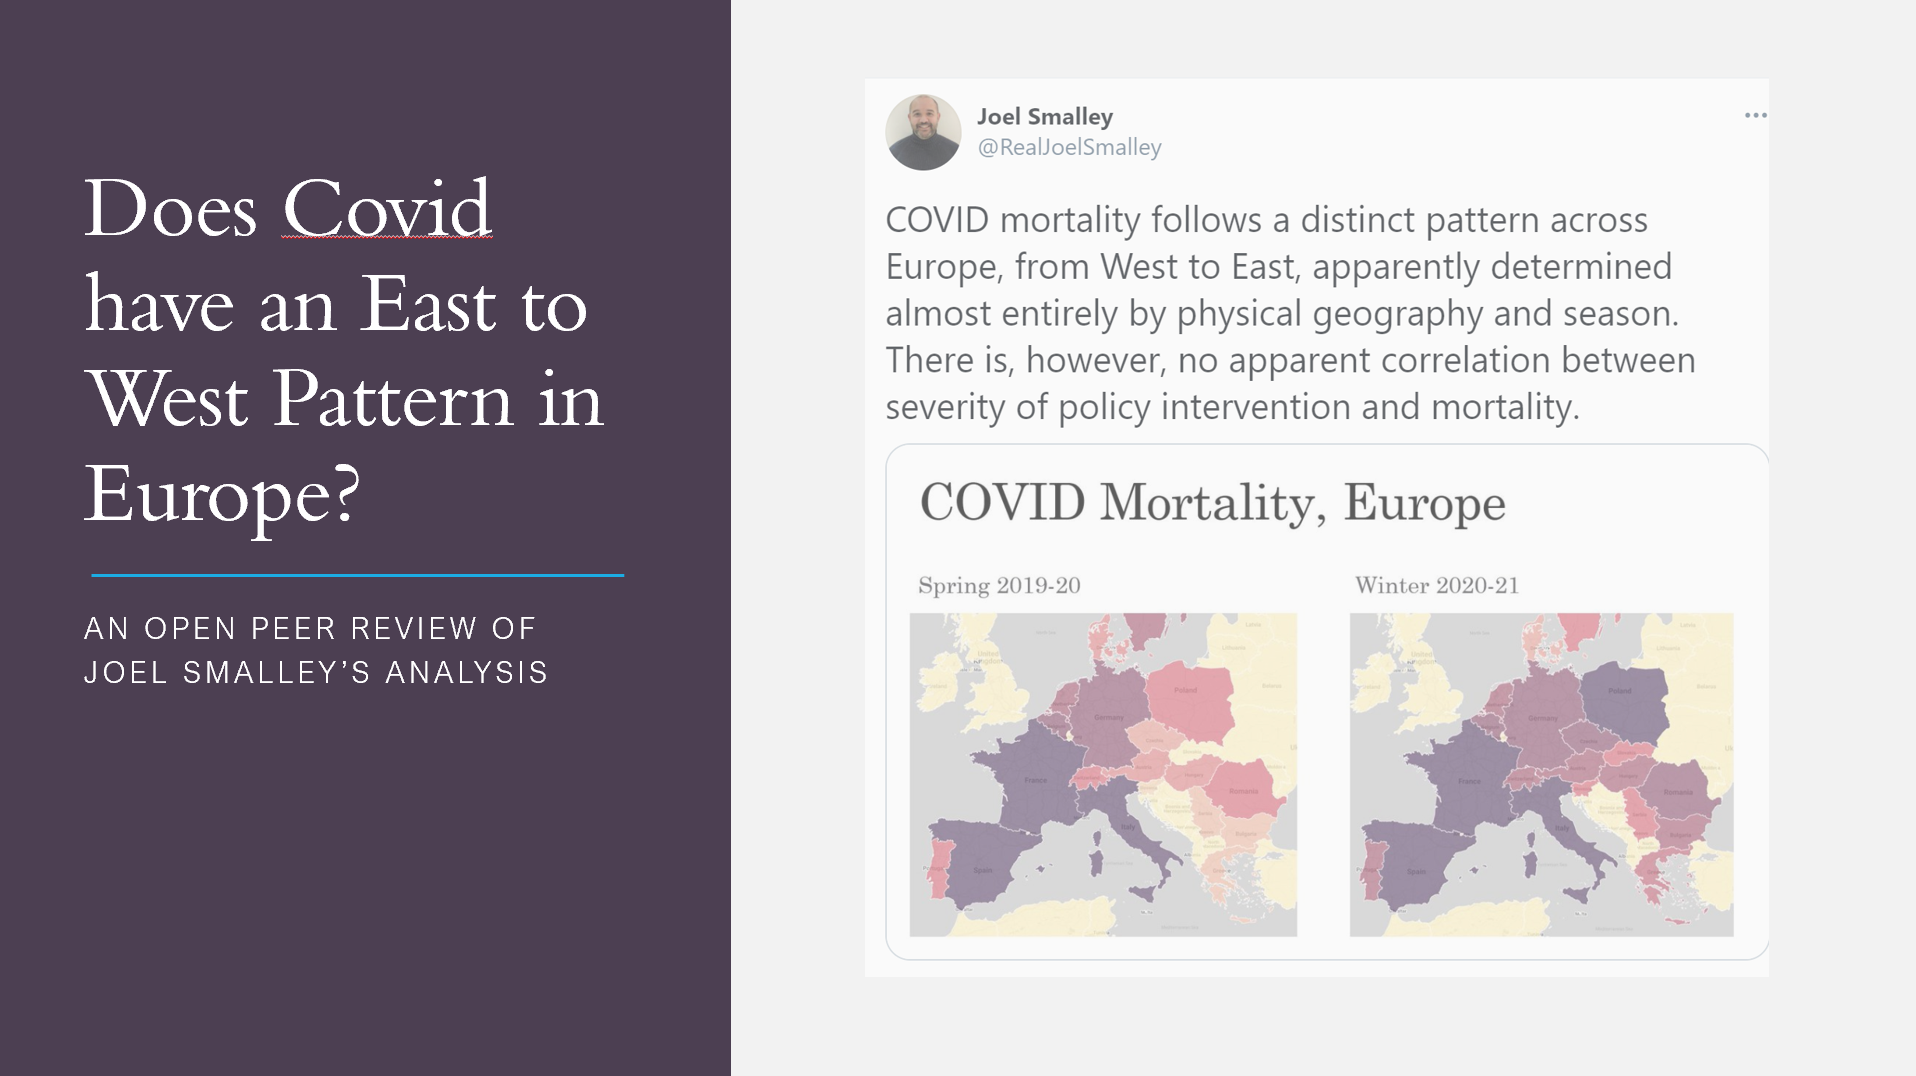
COVID mortality follows a distinct pattern across Europe, from West to East, apparently determined almost entirely by physical geography and season. There is, however, no apparent correlation between severity of policy intervention and mortality. pic.twitter.com/mKacsWru7u
— Joel Smalley (@RealJoelSmalley) January 22, 2021
“COVID mortality follows a distinct pattern across Europe, from West to East, apparently determined almost entirely by physical geography and season. There is, however, no apparent correlation between severity of policy intervention and mortality.”
“The different time intervals to peak during epidemic and endemic phases are also consistent in countries that suffered significant COVID exposure in Spring.”
“The similarity in distribution of COVID deaths in countries that share the same longitude is striking. Where I have done the analysis, it fits the profile of usual seasonal mortality.”
“Perhaps it is time to recognise that nature is responsible for the passage of the virus and natural immunological responses whose science has not been challenged before last year is responsible for dealing with it?”
Several questions are raised by this analysis:
- Is the evidence presented a clear sign of correlation? The original post infers that there is correlation between longitude and the patterns in Covid deaths. However, this has all been derived by visual inspect of the graphs, and no numerical value is provided.
- Do we have a case to build a causative relationship between the two? Joel states that because of the above correlation, the cause is “almost entirely by physical geography and season”. Is there sufficient evidence to make this claim, and are there other potential explanatory variables?
- Is there really no relationship between severity of intervention and mortality?
Recreating the analysis
To ensure a fair comparison, it is important we first recreate the analysis. As no methodology was published, we are going to try and get as much information out of the tweets as possible. I provide all my processing within GitHub for others to review, so please feel free to look if you want to understand more. If the assumptions are wrong, they can be tweaked.
Data Sources
Two data sources were provided:
- The stringency index scores the level of interventions provides a measure of the how much restriction is in place to control Covid. Essentially under normal conditions this would be equal to 0, and as measure such as lockdowns get introduced, this can be increased up to a value of 100. More is explained here.
- Weekly Covid deaths per country, as provided by the EU Open Data Portal/ Note the dataset used here is slightly behind, only going up until December. As with all death related datasets, there can be a delay in these fully representing the data.
Summary Map
Okay, the article starts with a summary of the deaths in Winter and Spring. I’ve include the whole of Europe for arguments sake.
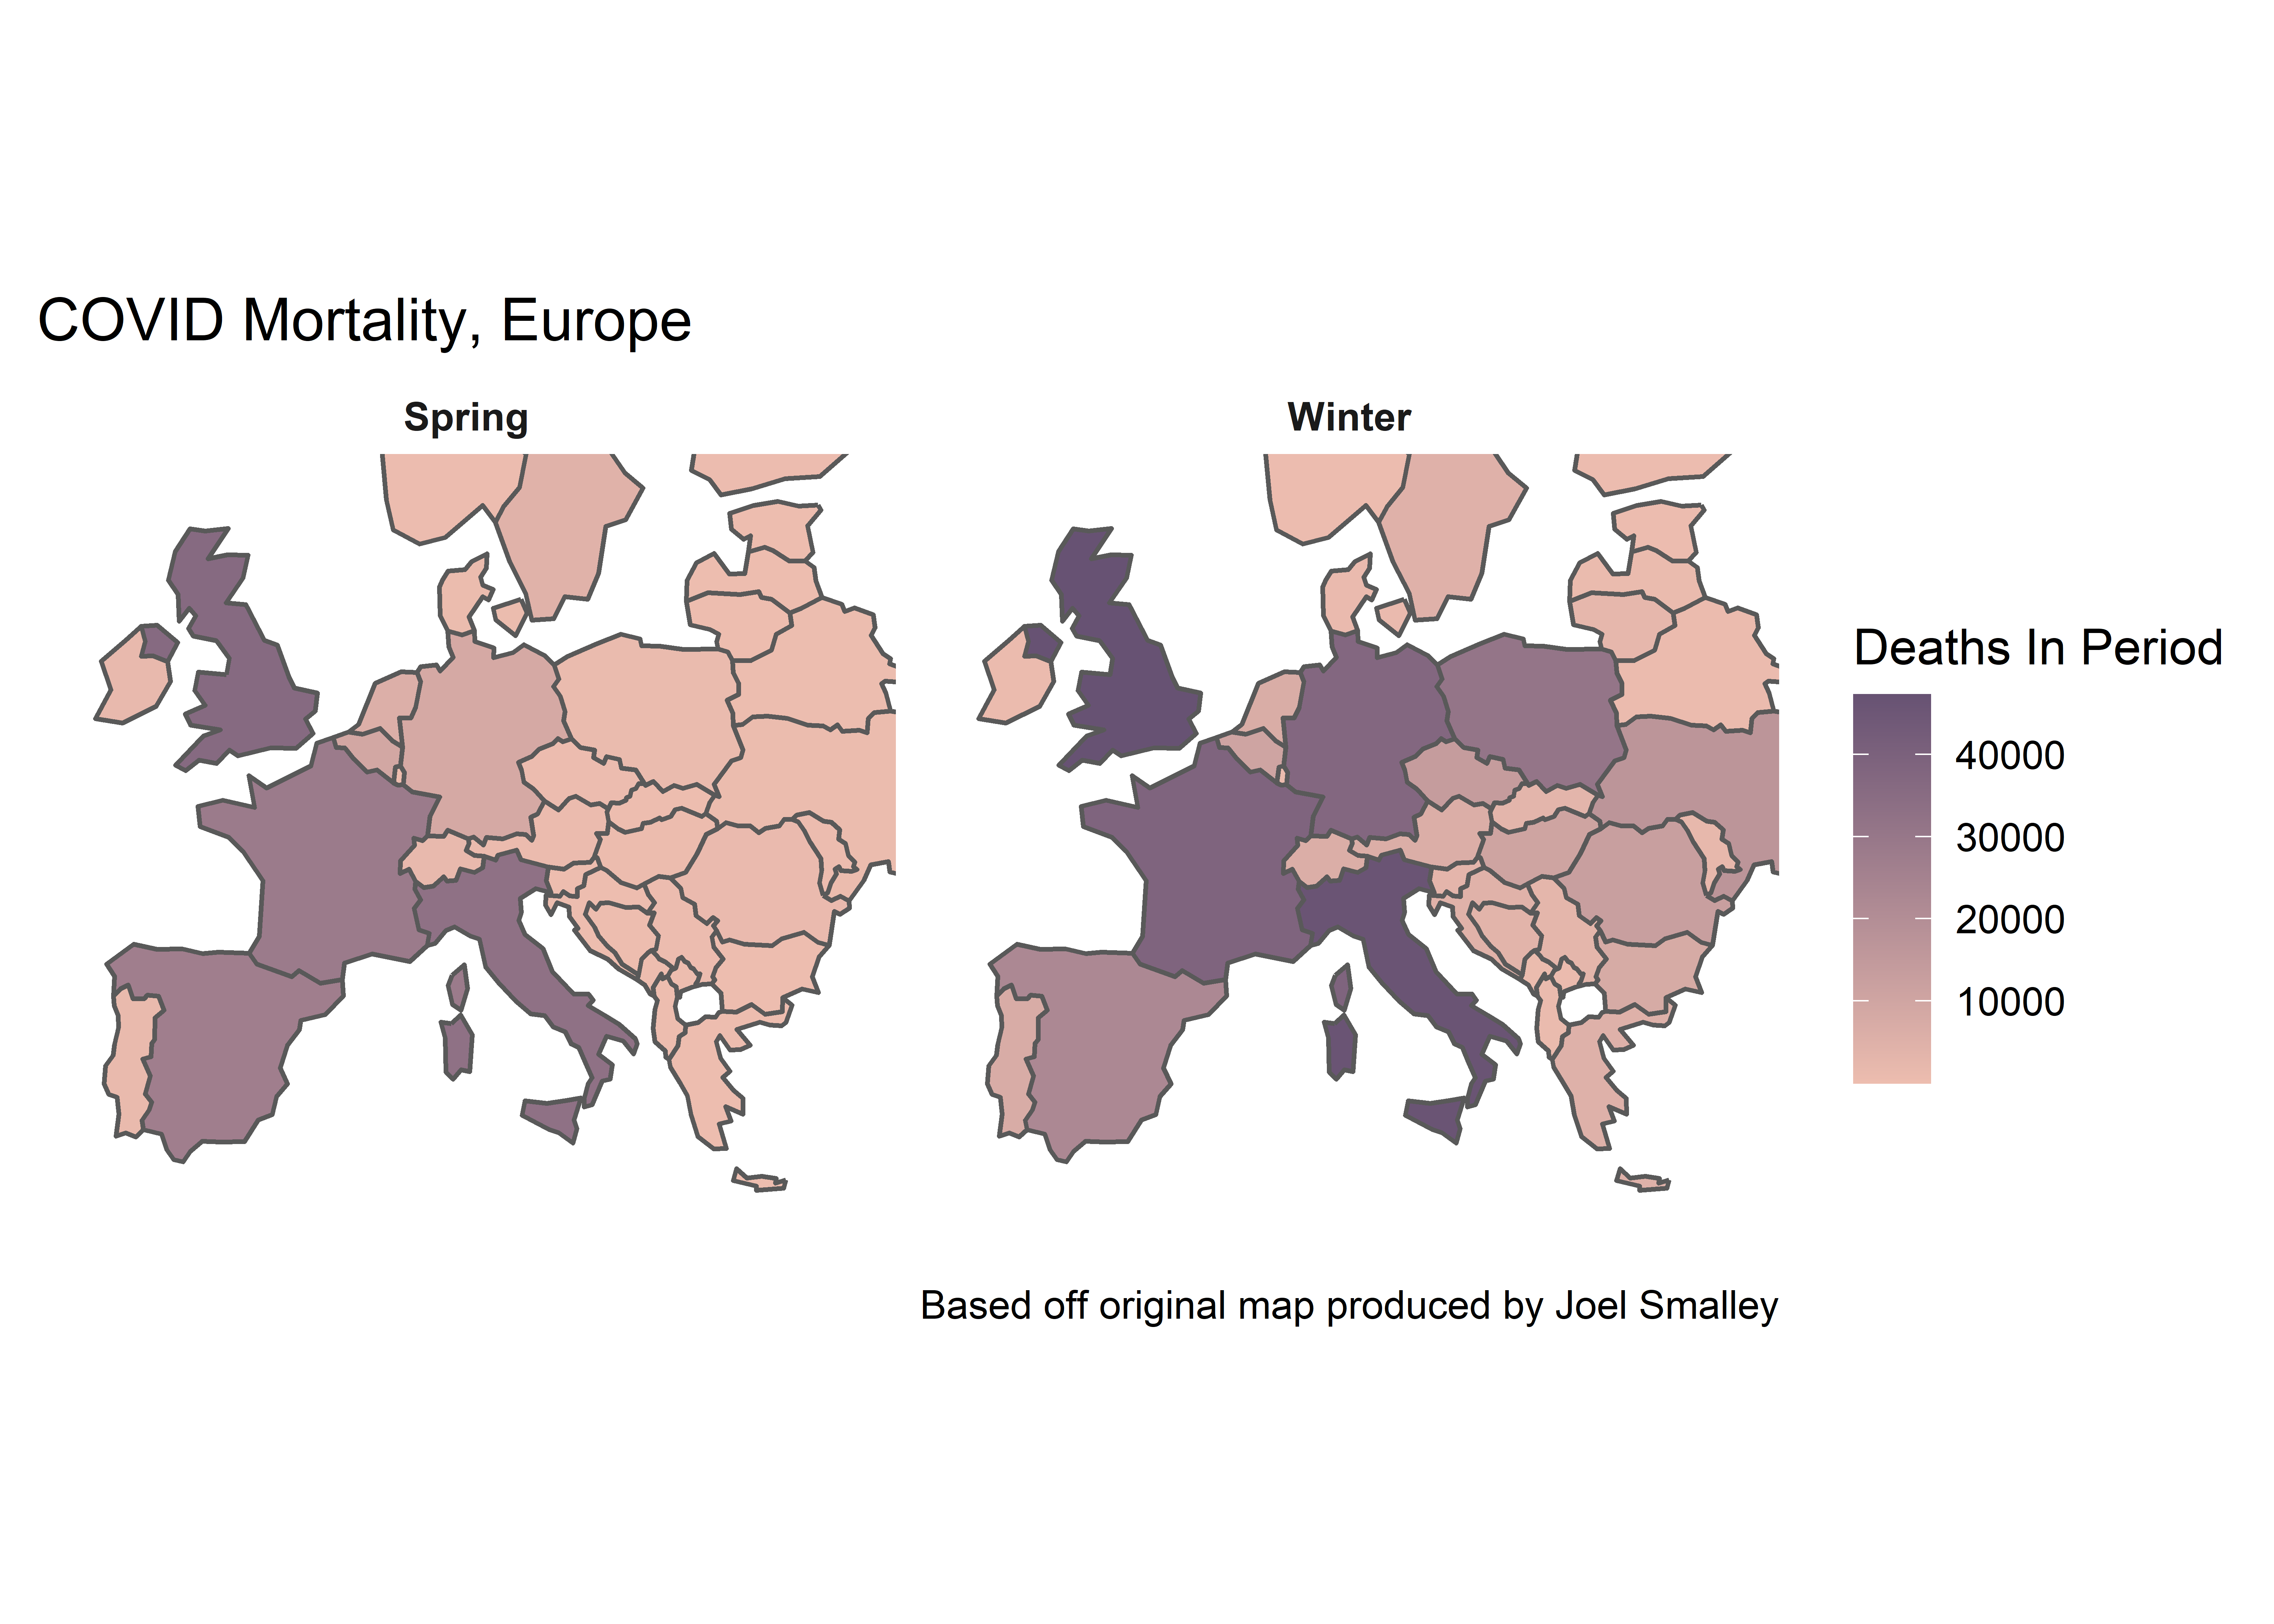
I am not entirely sure what point this map is trying to prove, but it does demonstrate there are countries in Eastern Europe which were relatively minimal impact in Spring while are more so in Winter. Many countries in Western Europe seem to have had two spikes (i.e. United Kingdom, Italy, France).
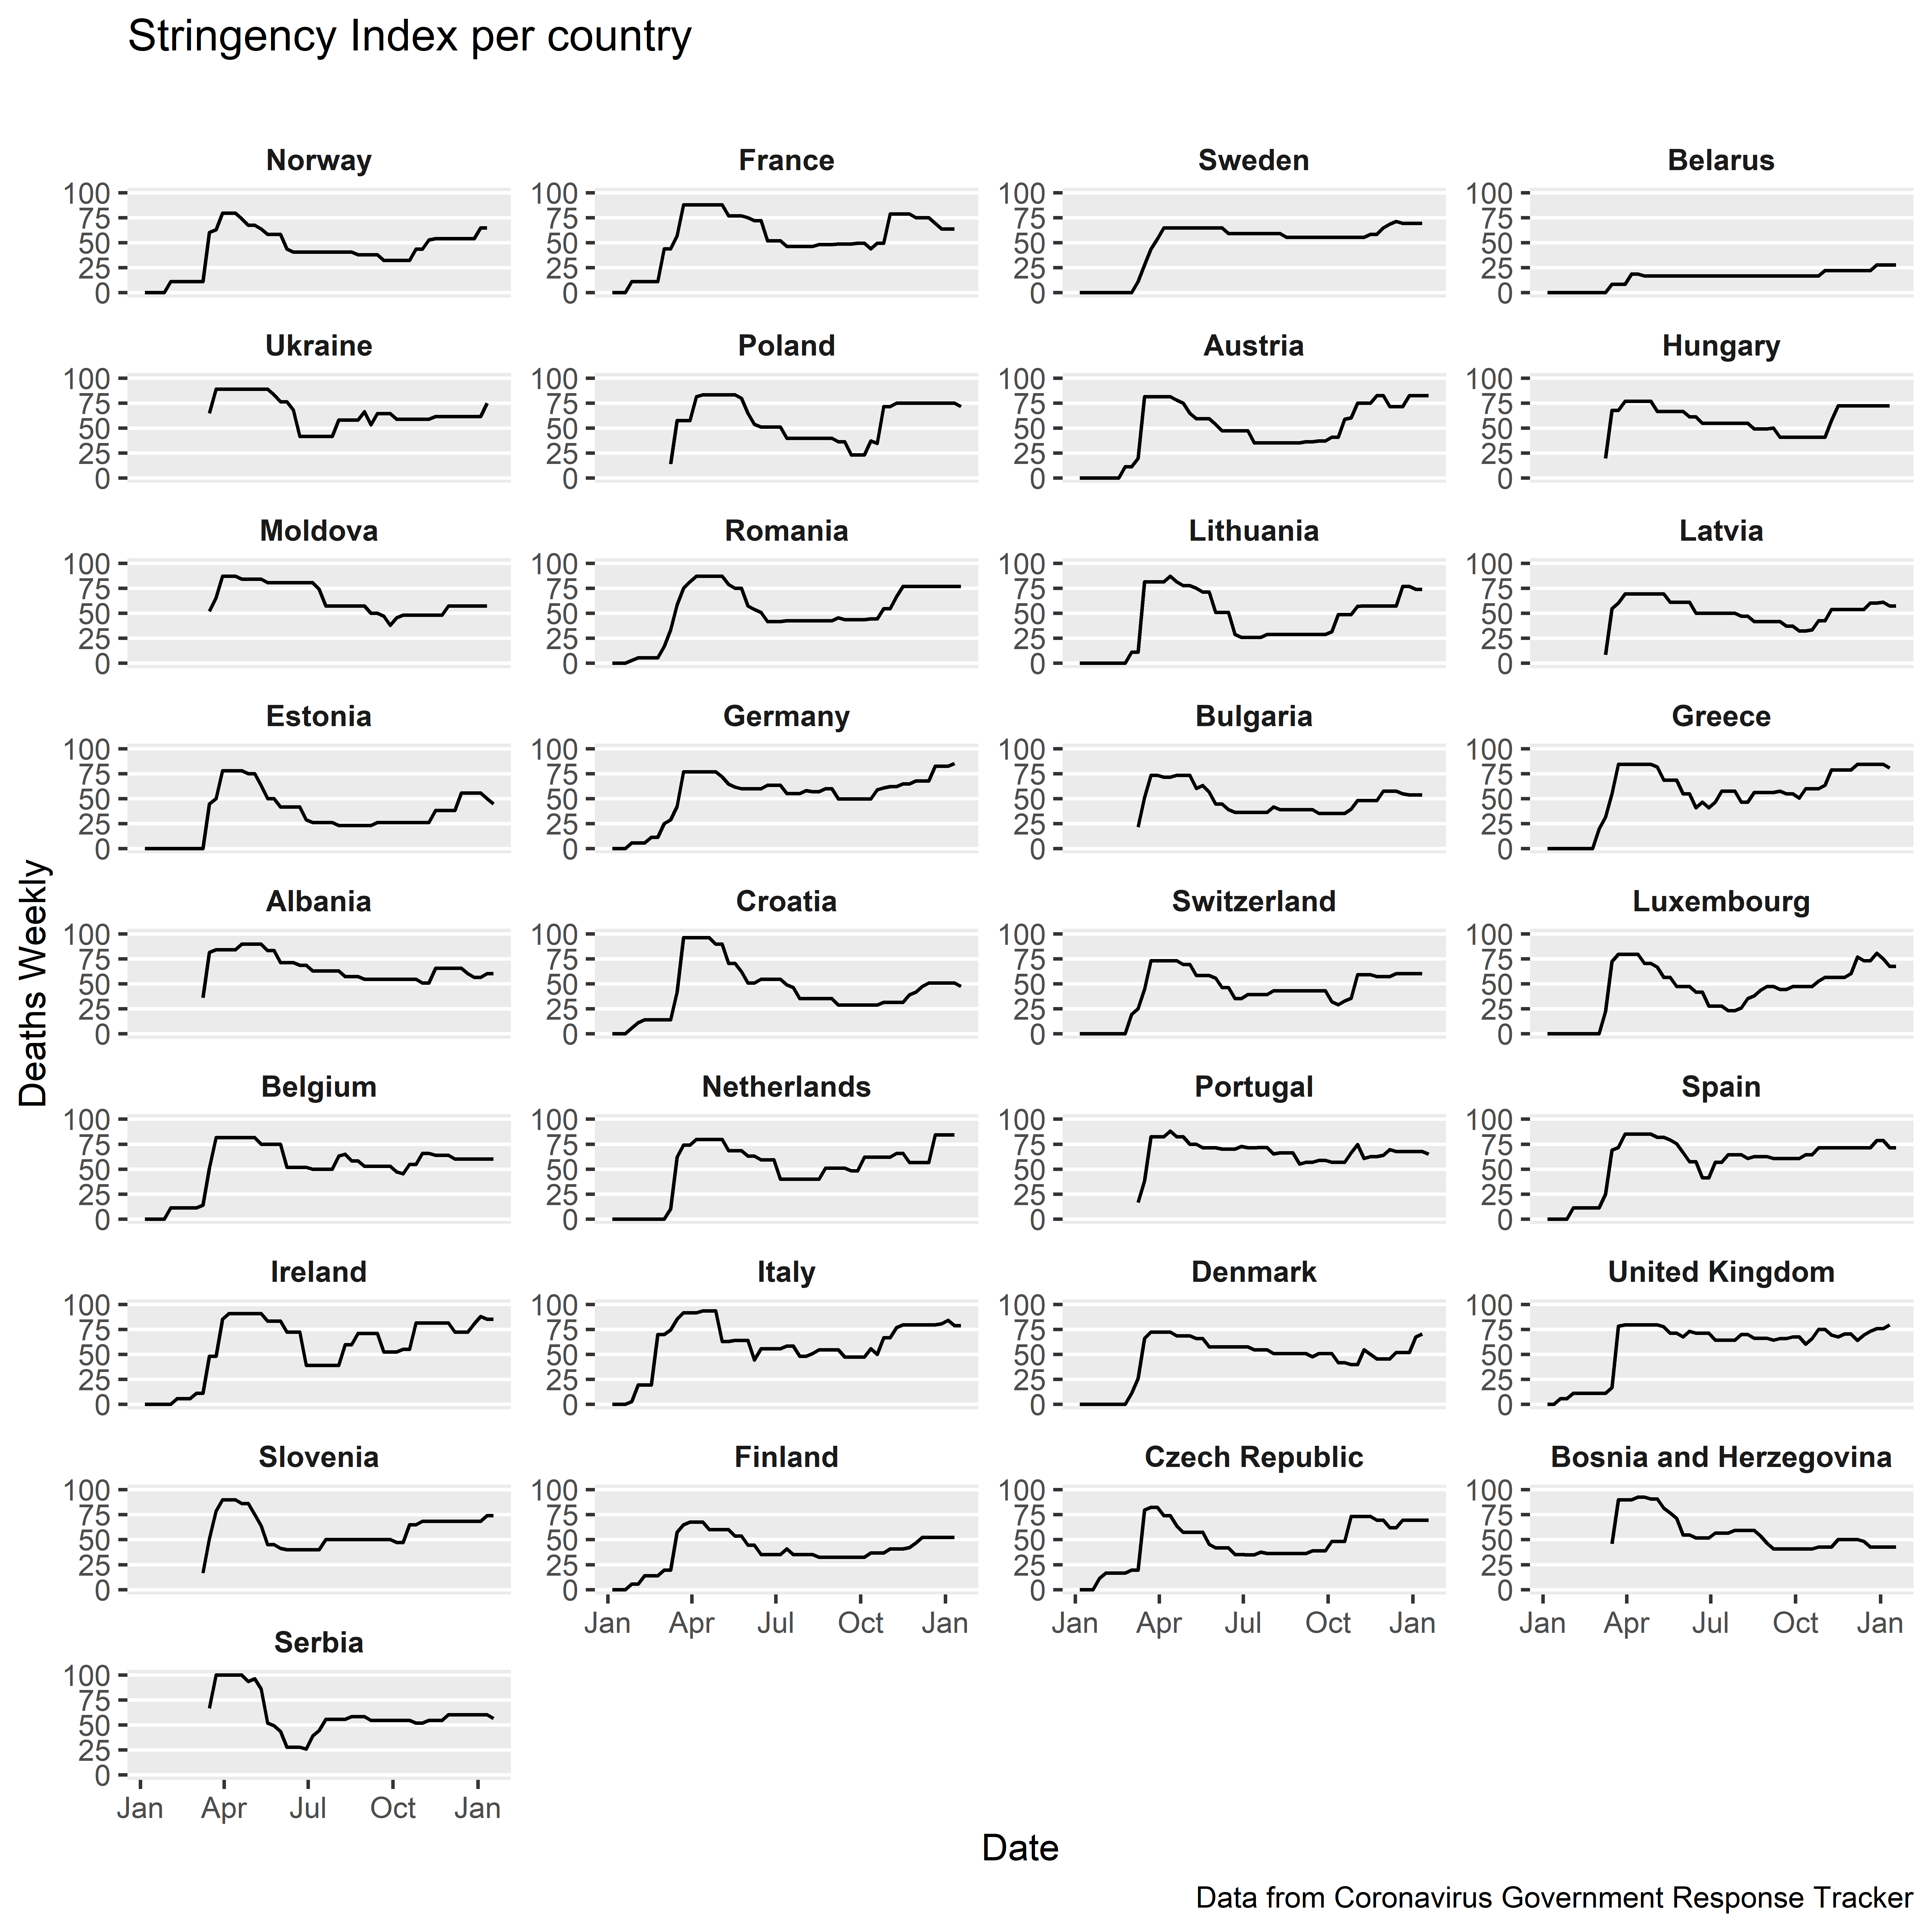
Time Plots
Again, we can recreate the plots. Before we jump into the grouping, I am going to present them as a single list with no categories. It is useful to make a quick comparison yourself to see whether you notice there are any potential similarities in the dataset. If you are extra keen, try separating these into your own groups of similar style lines. To prevent you having any bias, I have removed any labels for the country names so all you can use is the data.
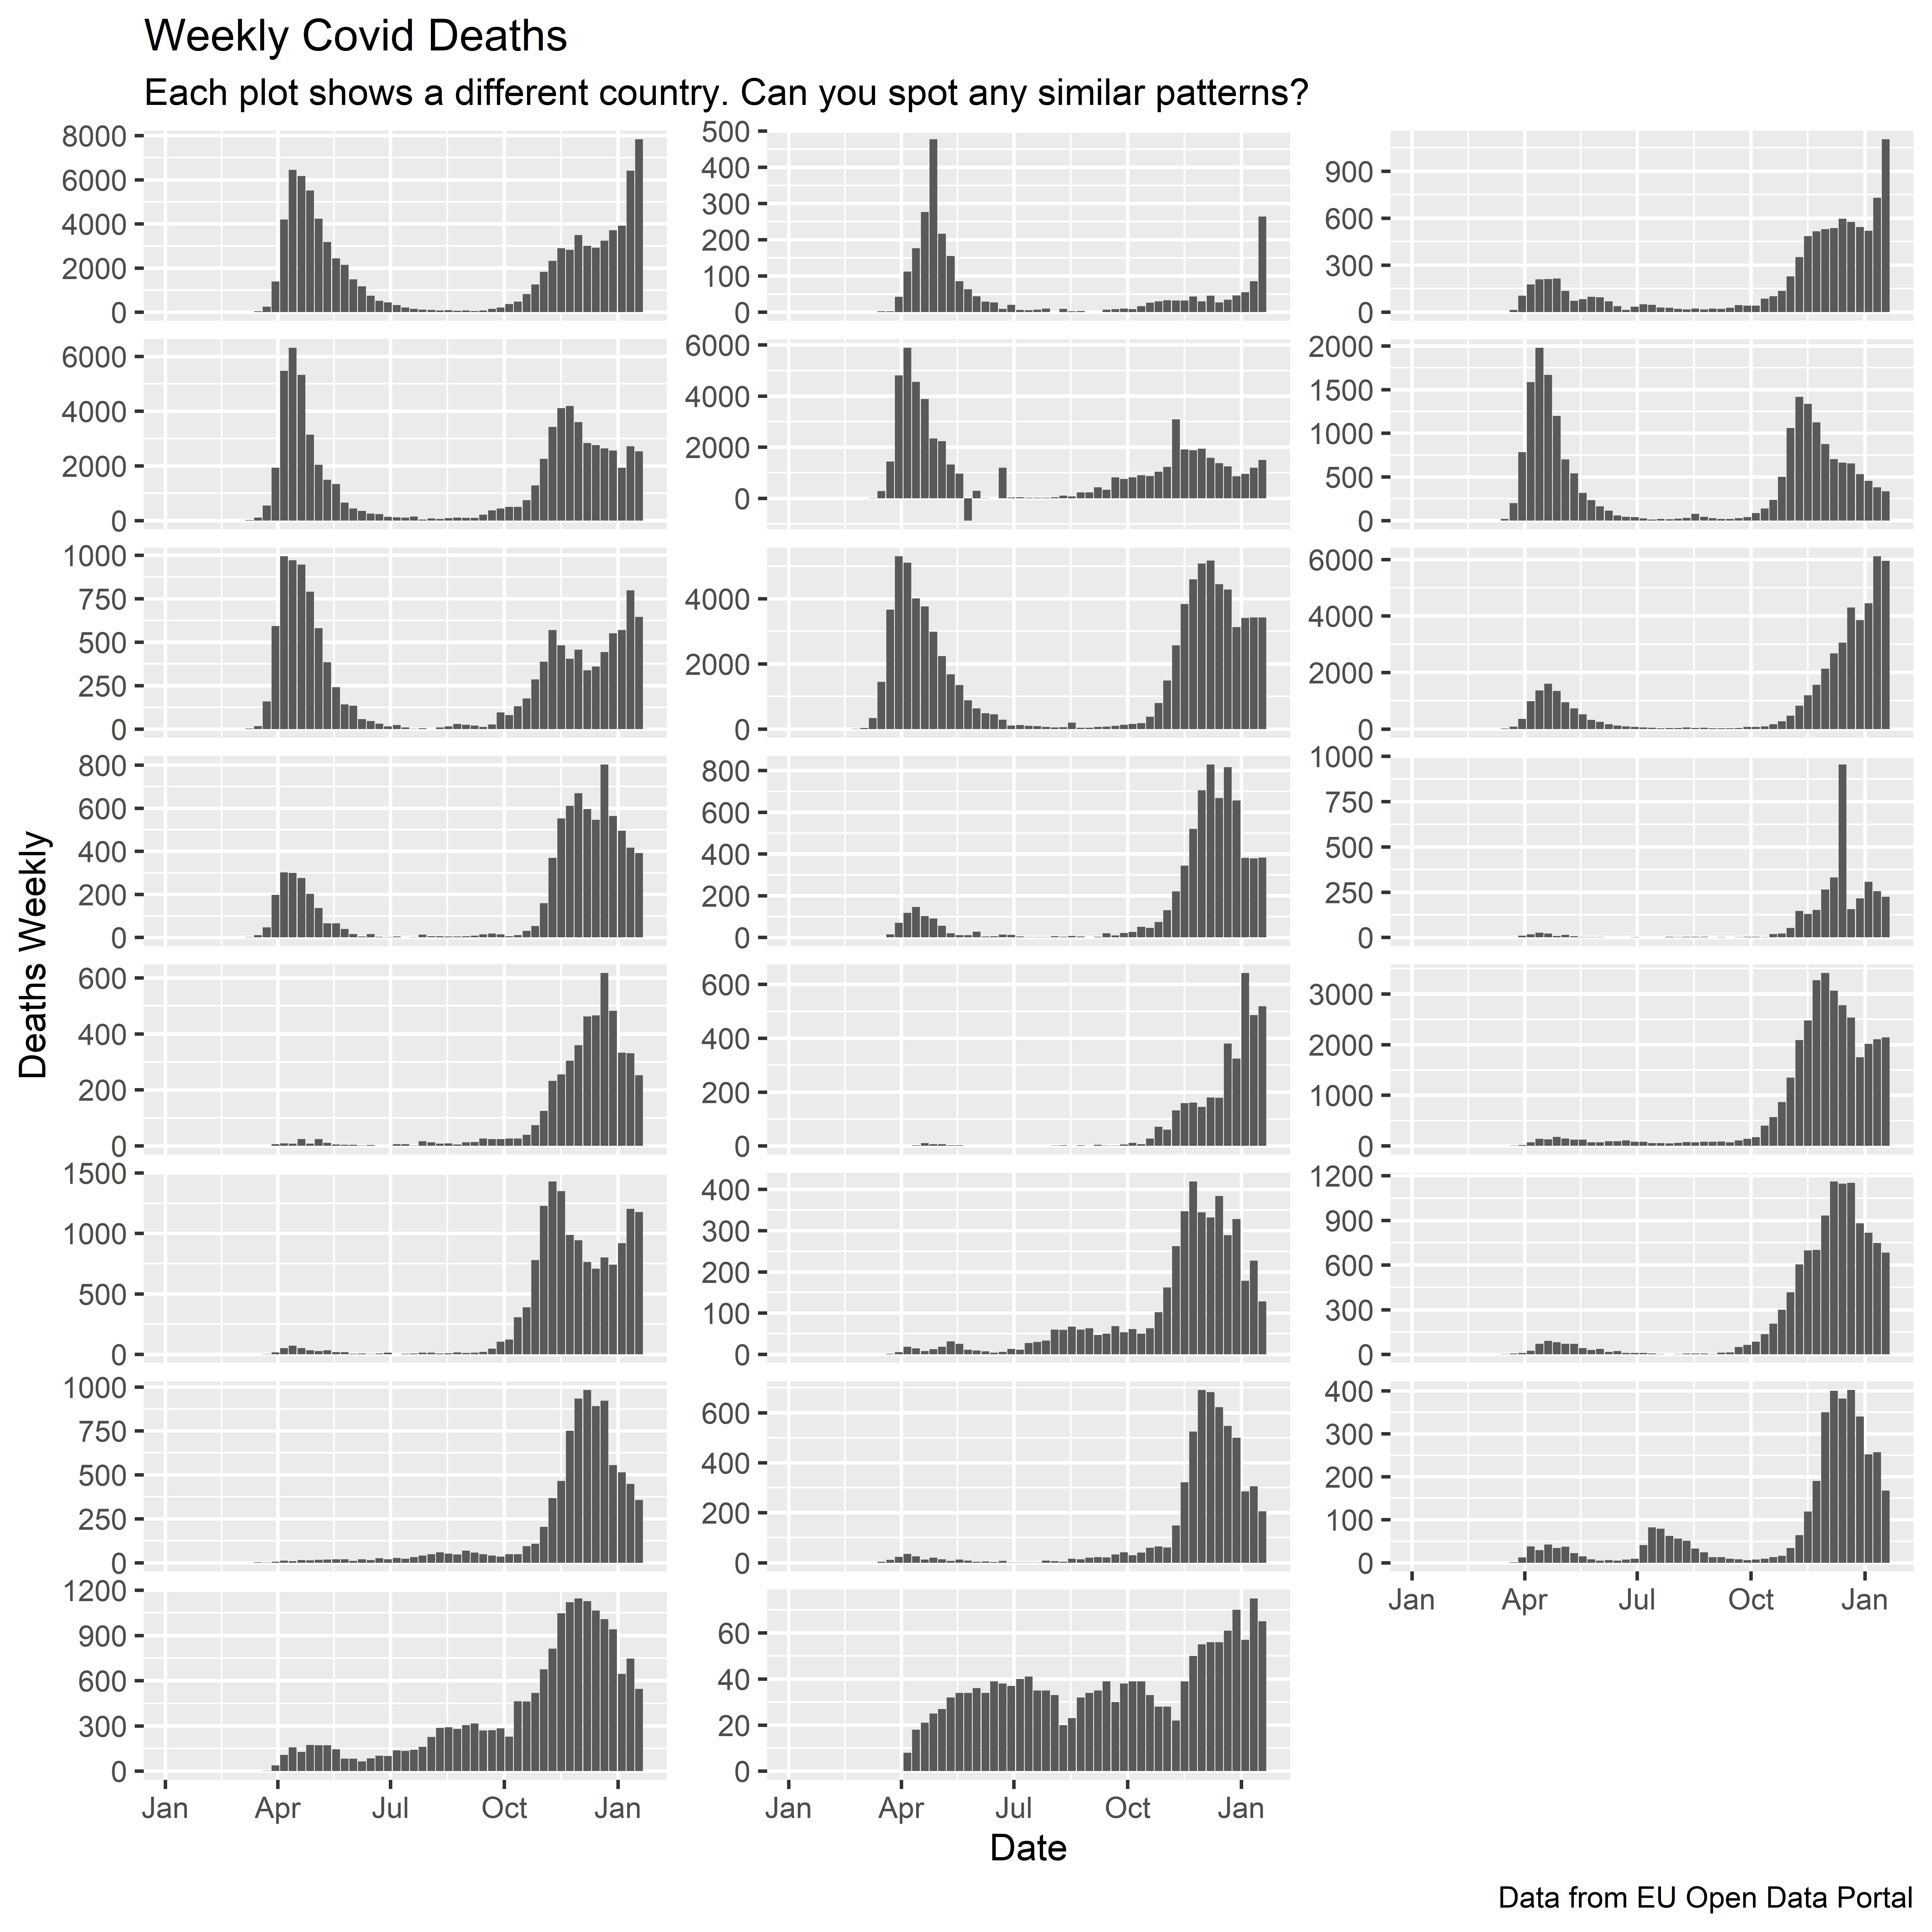
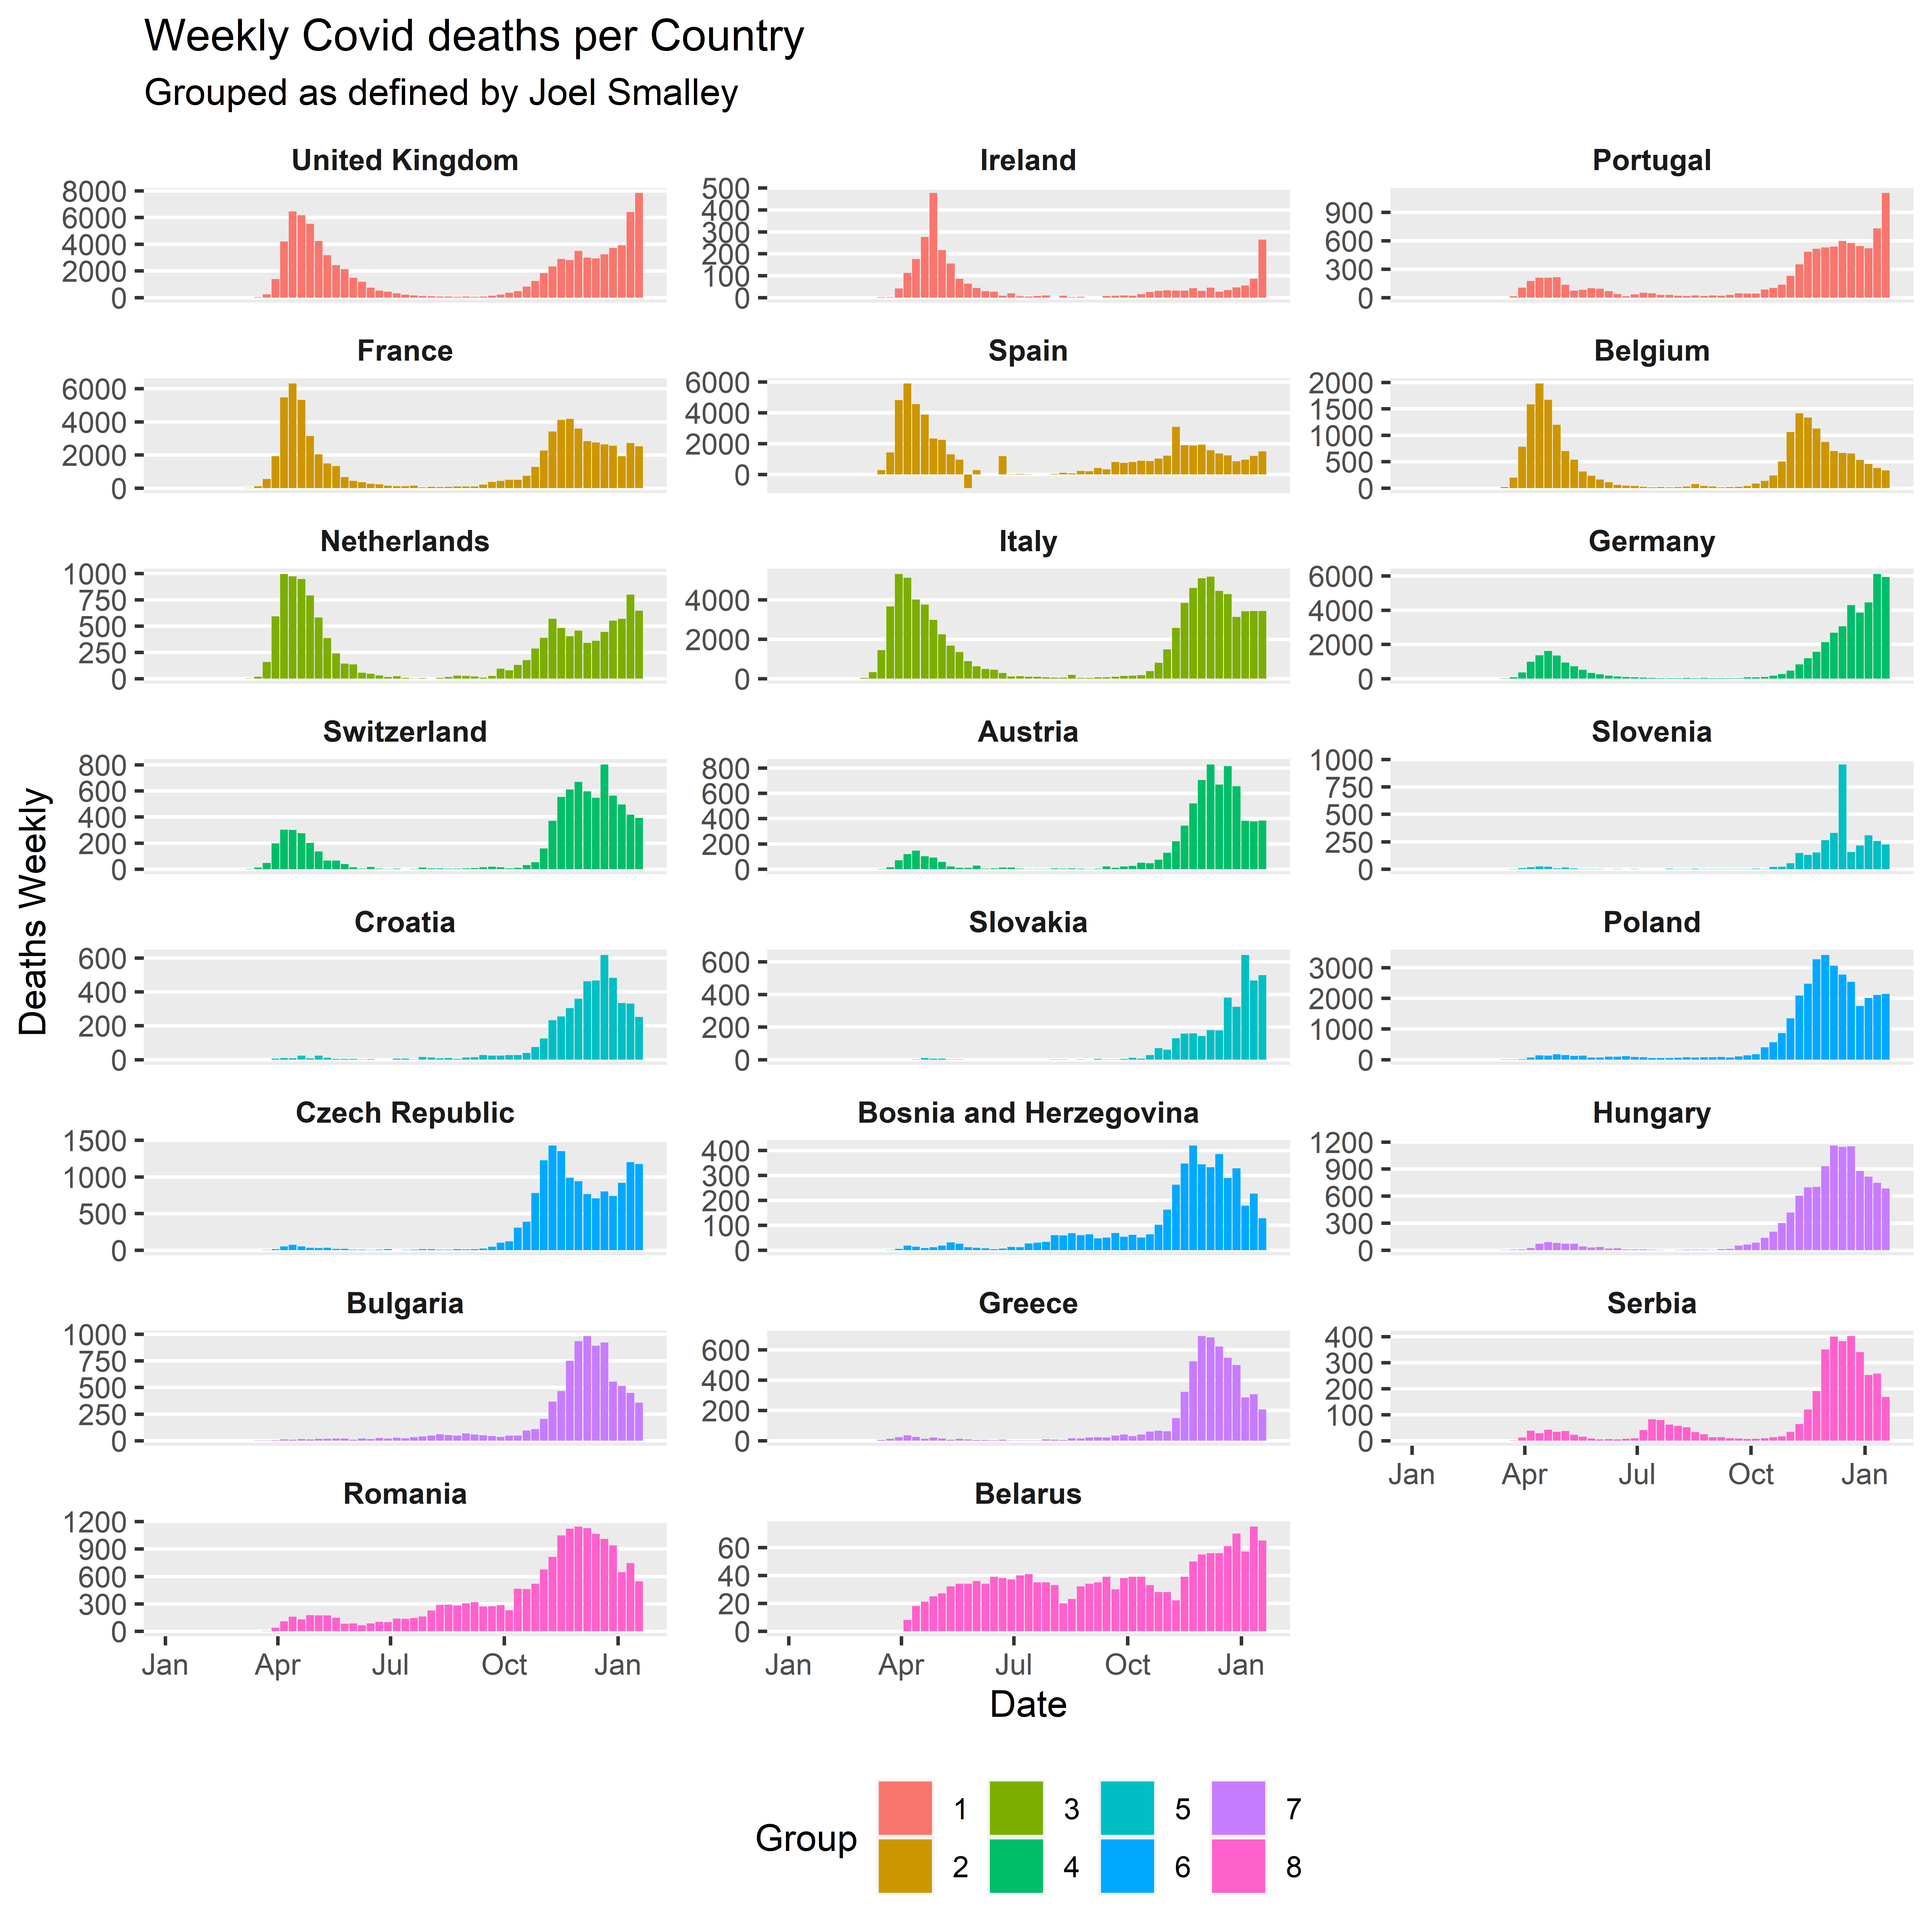
Okay, have you had a try at labelling them? Having had a look without any splitting, we can now plot these as grouped by Joel. To help with Joel’s point, we can also visualise these trends on a map.
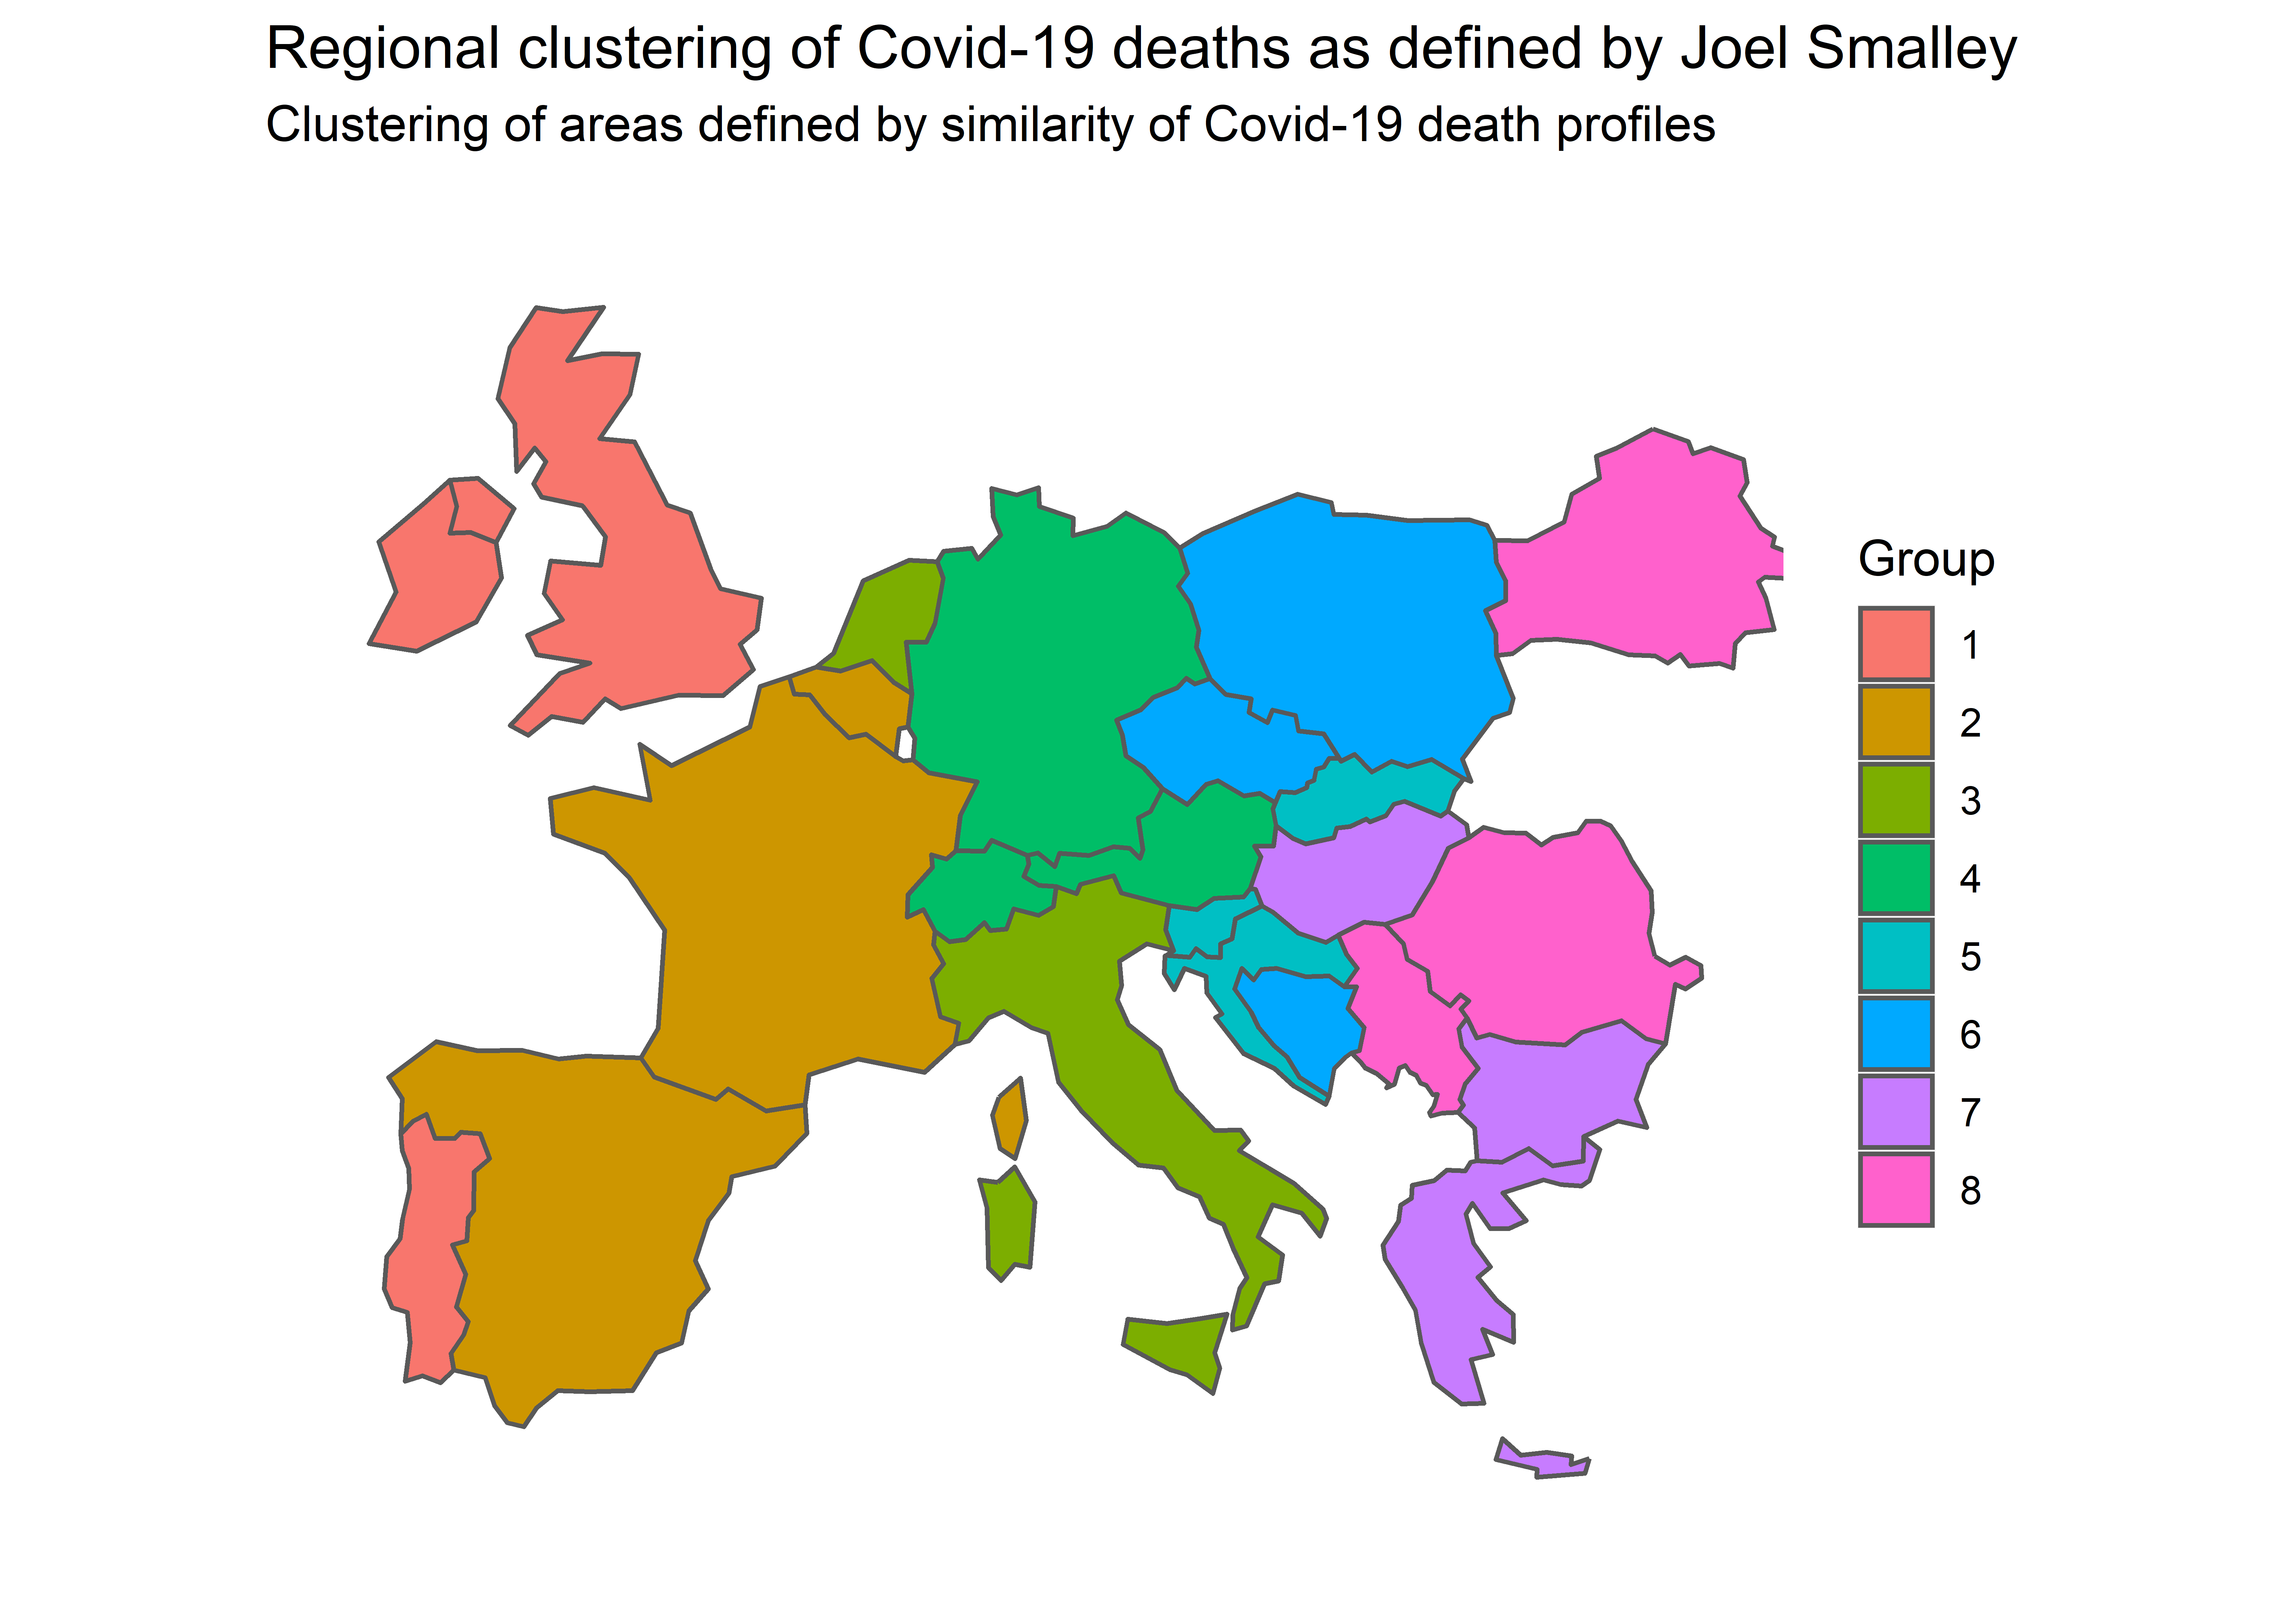
So, how would I review this clustering by Joel?
- Looking at the graph, you can clearly see similar patterns between countries that are grouped. Broadly these are defined by whether they have a peak in Spring, and the severity of the increase up until December 2020.
- There are some clear exceptions to the rules. For example, Portugal has been put into the same category as the UK and Ireland, although there was clearly a smaller first wave.
- By looking at the map, we can notice that the clustering is not purely on a East/West divide. For example, Hungary has been grouped with Greece and Bulgaria.
- Also, regions with similar patterns do not necessarily border each other: for example the Netherlands and Italy.
While this provides interesting empirical evidence, in the format presented, it cannot be used to assert the claims made of the relationship being determined “almost entirely by physical geography”. The grouping appears done by manual classification, and no numerical justification provided beyond the graphs, so we cannot directly correlate in this format that East/West has an impact. But is there any way we might be able to explore this concept further? We can explore that further below.
Exploring East/West Correlation
Okay, so hopefully all of the work so far has made sense! As mentioned above, the above work from Joel provided a useful framing of the problem, but did not statistically prove a relationship from East to West. This section will explore this and try and understand if there is correlation.
There are many statistical models available, but a good approach for this kind of question is to use a clustering analysis. This is a machine learning approach which tries to identiy similar patterns in data. As explained here:
Cluster analysis is a task which concerns itself with the creation of groups of objects, where each group is called a cluster. Ideally, all members of the same cluster are similar to each other, but are as dissimilar as possible from objects in a different cluster
So in this case, we are wanting to compare the pattern of the Covid-19 deaths for each of the countries and to join them together. Essentially, we are doing exactly what Joel did above, but removing any opportunity for subjectivity.

There are a few design choices to be made in the model. The purpose of these are explained below:
- I decided to use scaled deaths data. i.e. i.e. deaths were adjusted to per 1000 people. Without doing this, there is a risk the clustering will just group together large and small countries. We are more interested in seeing the patterns of the data (i.e. spikes in Spring).
- We can define the number of groups that we want to split the data into. The more groups define, the better fit we will get for the data, but the harder it becomes to interpret.
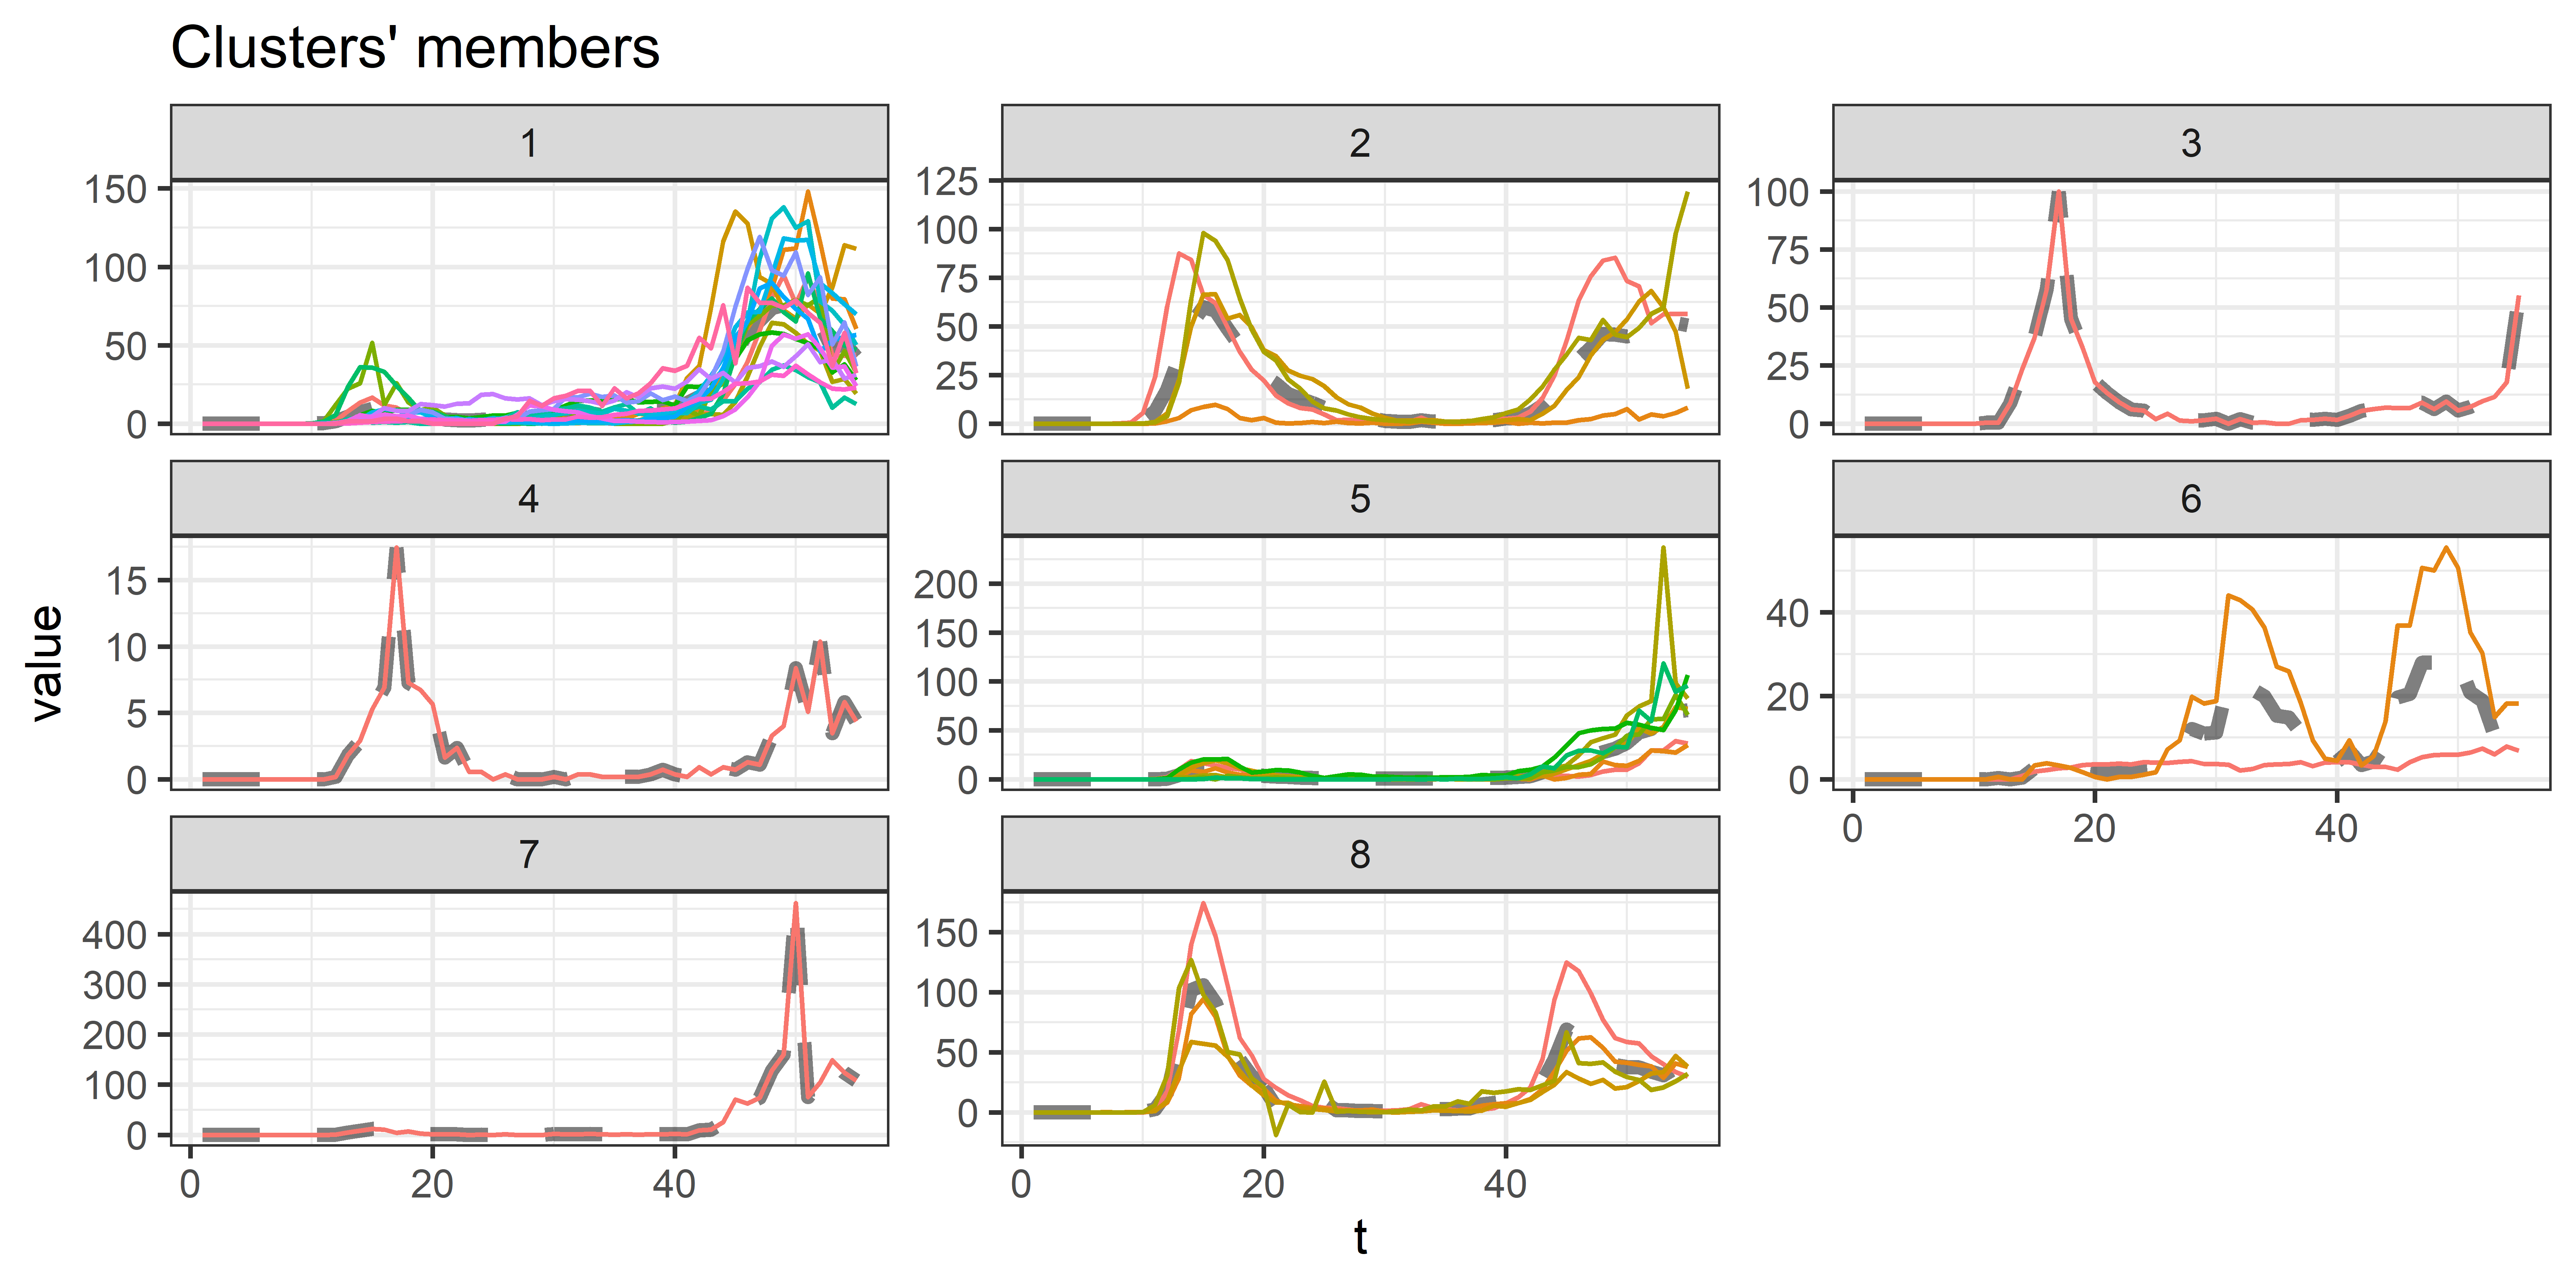
To start with I chose the same number of groups provided by Joel (8). Note, there is no condition limiting each group to a maximum size, so it will pair together all the most similar lines. The dashed line shows the mean value of all lines which have been put together in each group, and we can see there are a few different types of patterns occuring. For example, Group 6 includes countries which exhibit spikes in both Spring and Winter.
As shown below, this relationship is easier to see on the map. It is interesting to see that there do seem to be patterns in countries, although the relationships follow different patterns to those identified in the original analysis. There still does seem to be regional clustering though, but the patterns are less consistent.
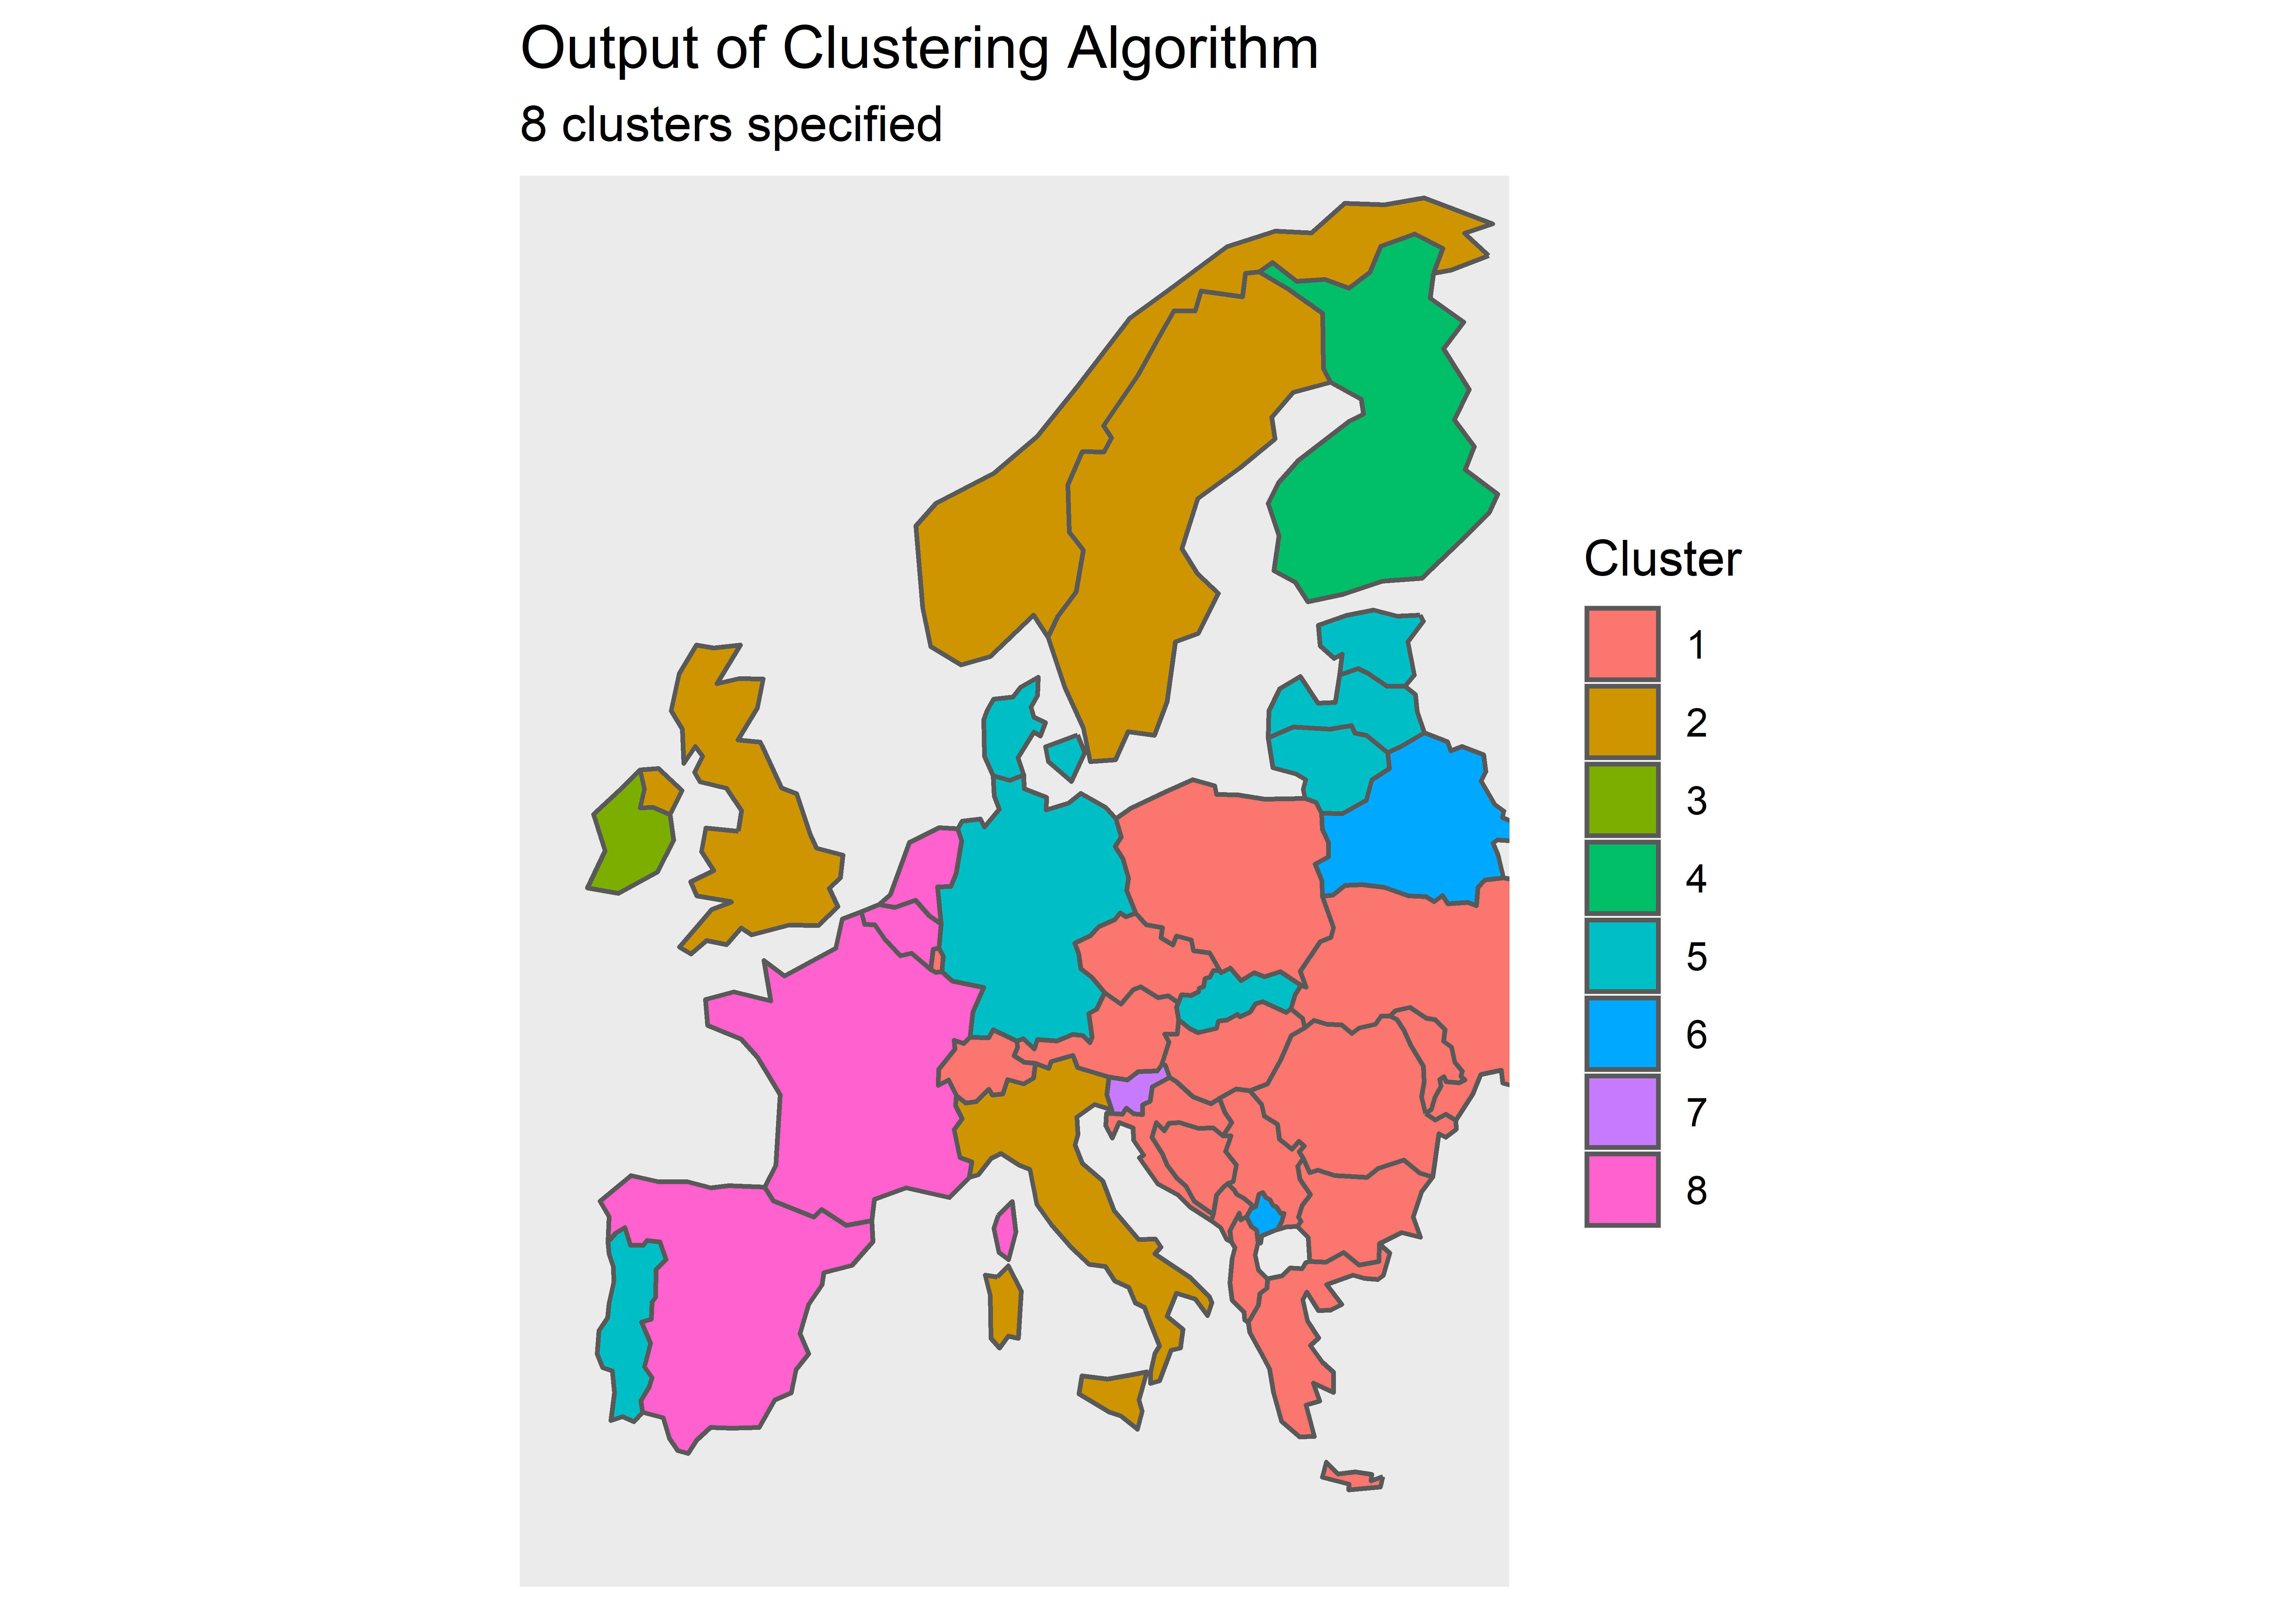
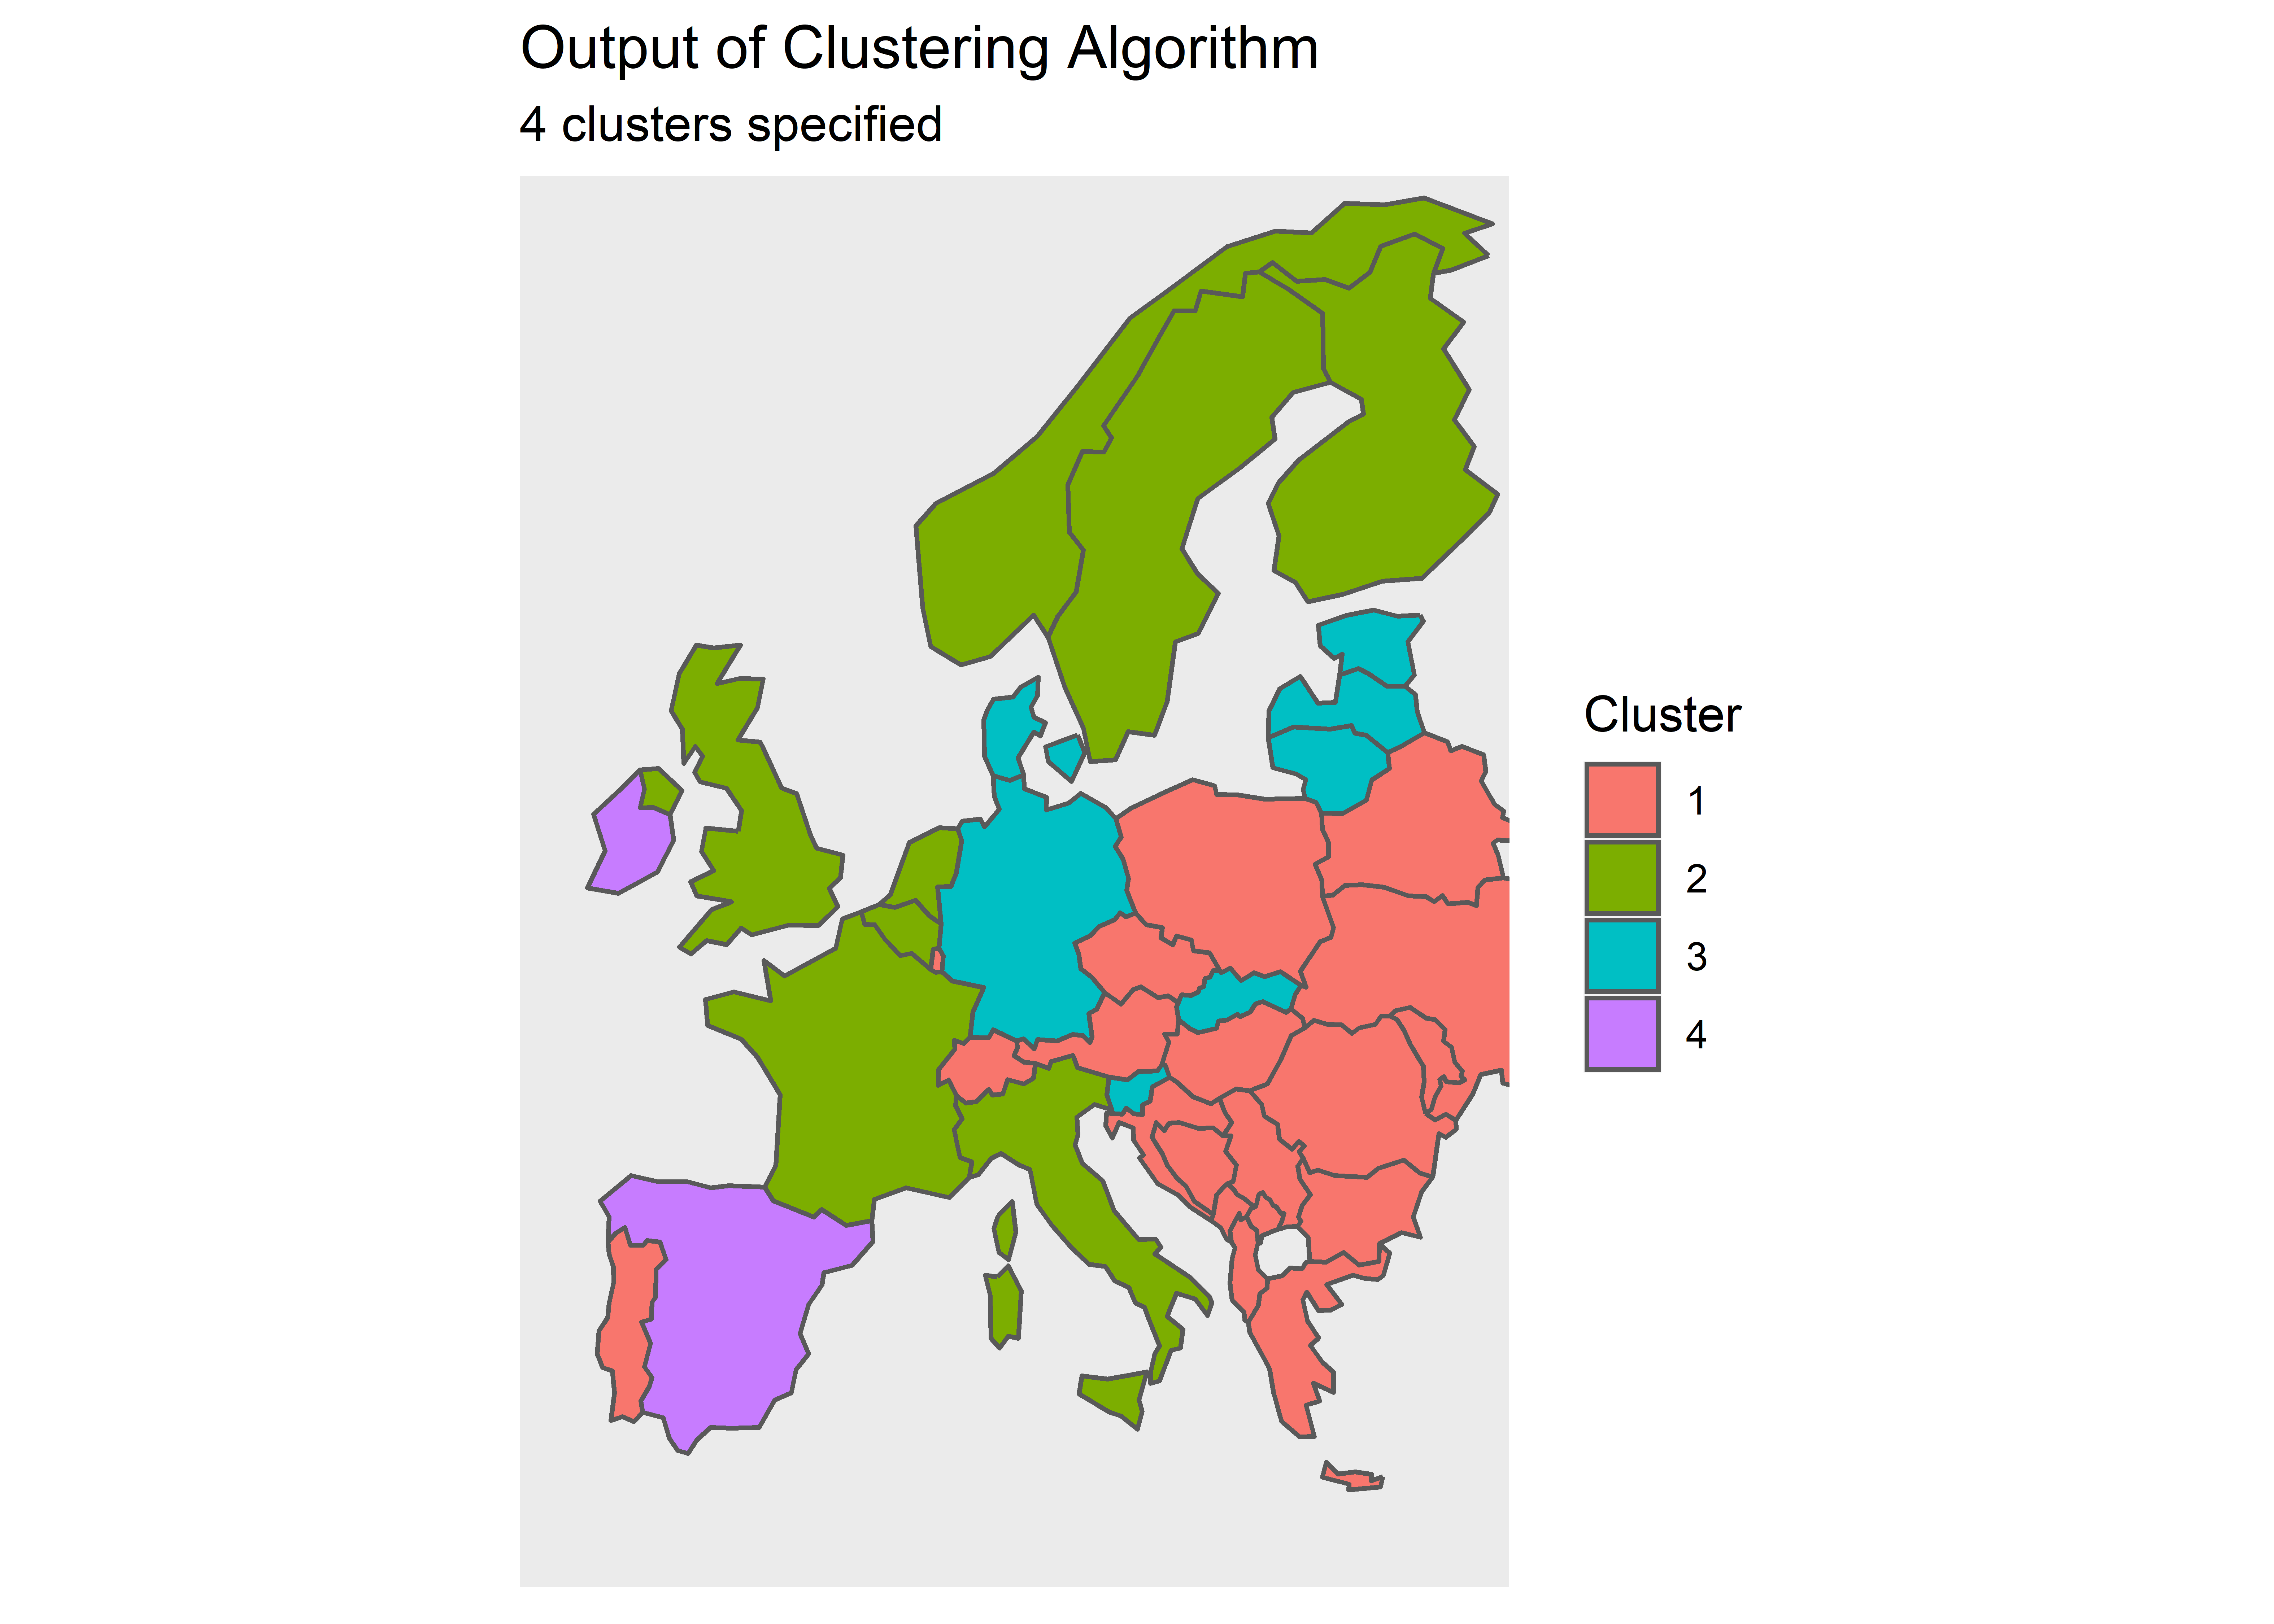
After some exploring the cluster size, I decided it would be better to cut it down from 8. As you can see from the figure above, it is hard to tell the difference between each group, and therefore risked spllitting the data into too many groups. The figure below shows the results with 4 clusters.
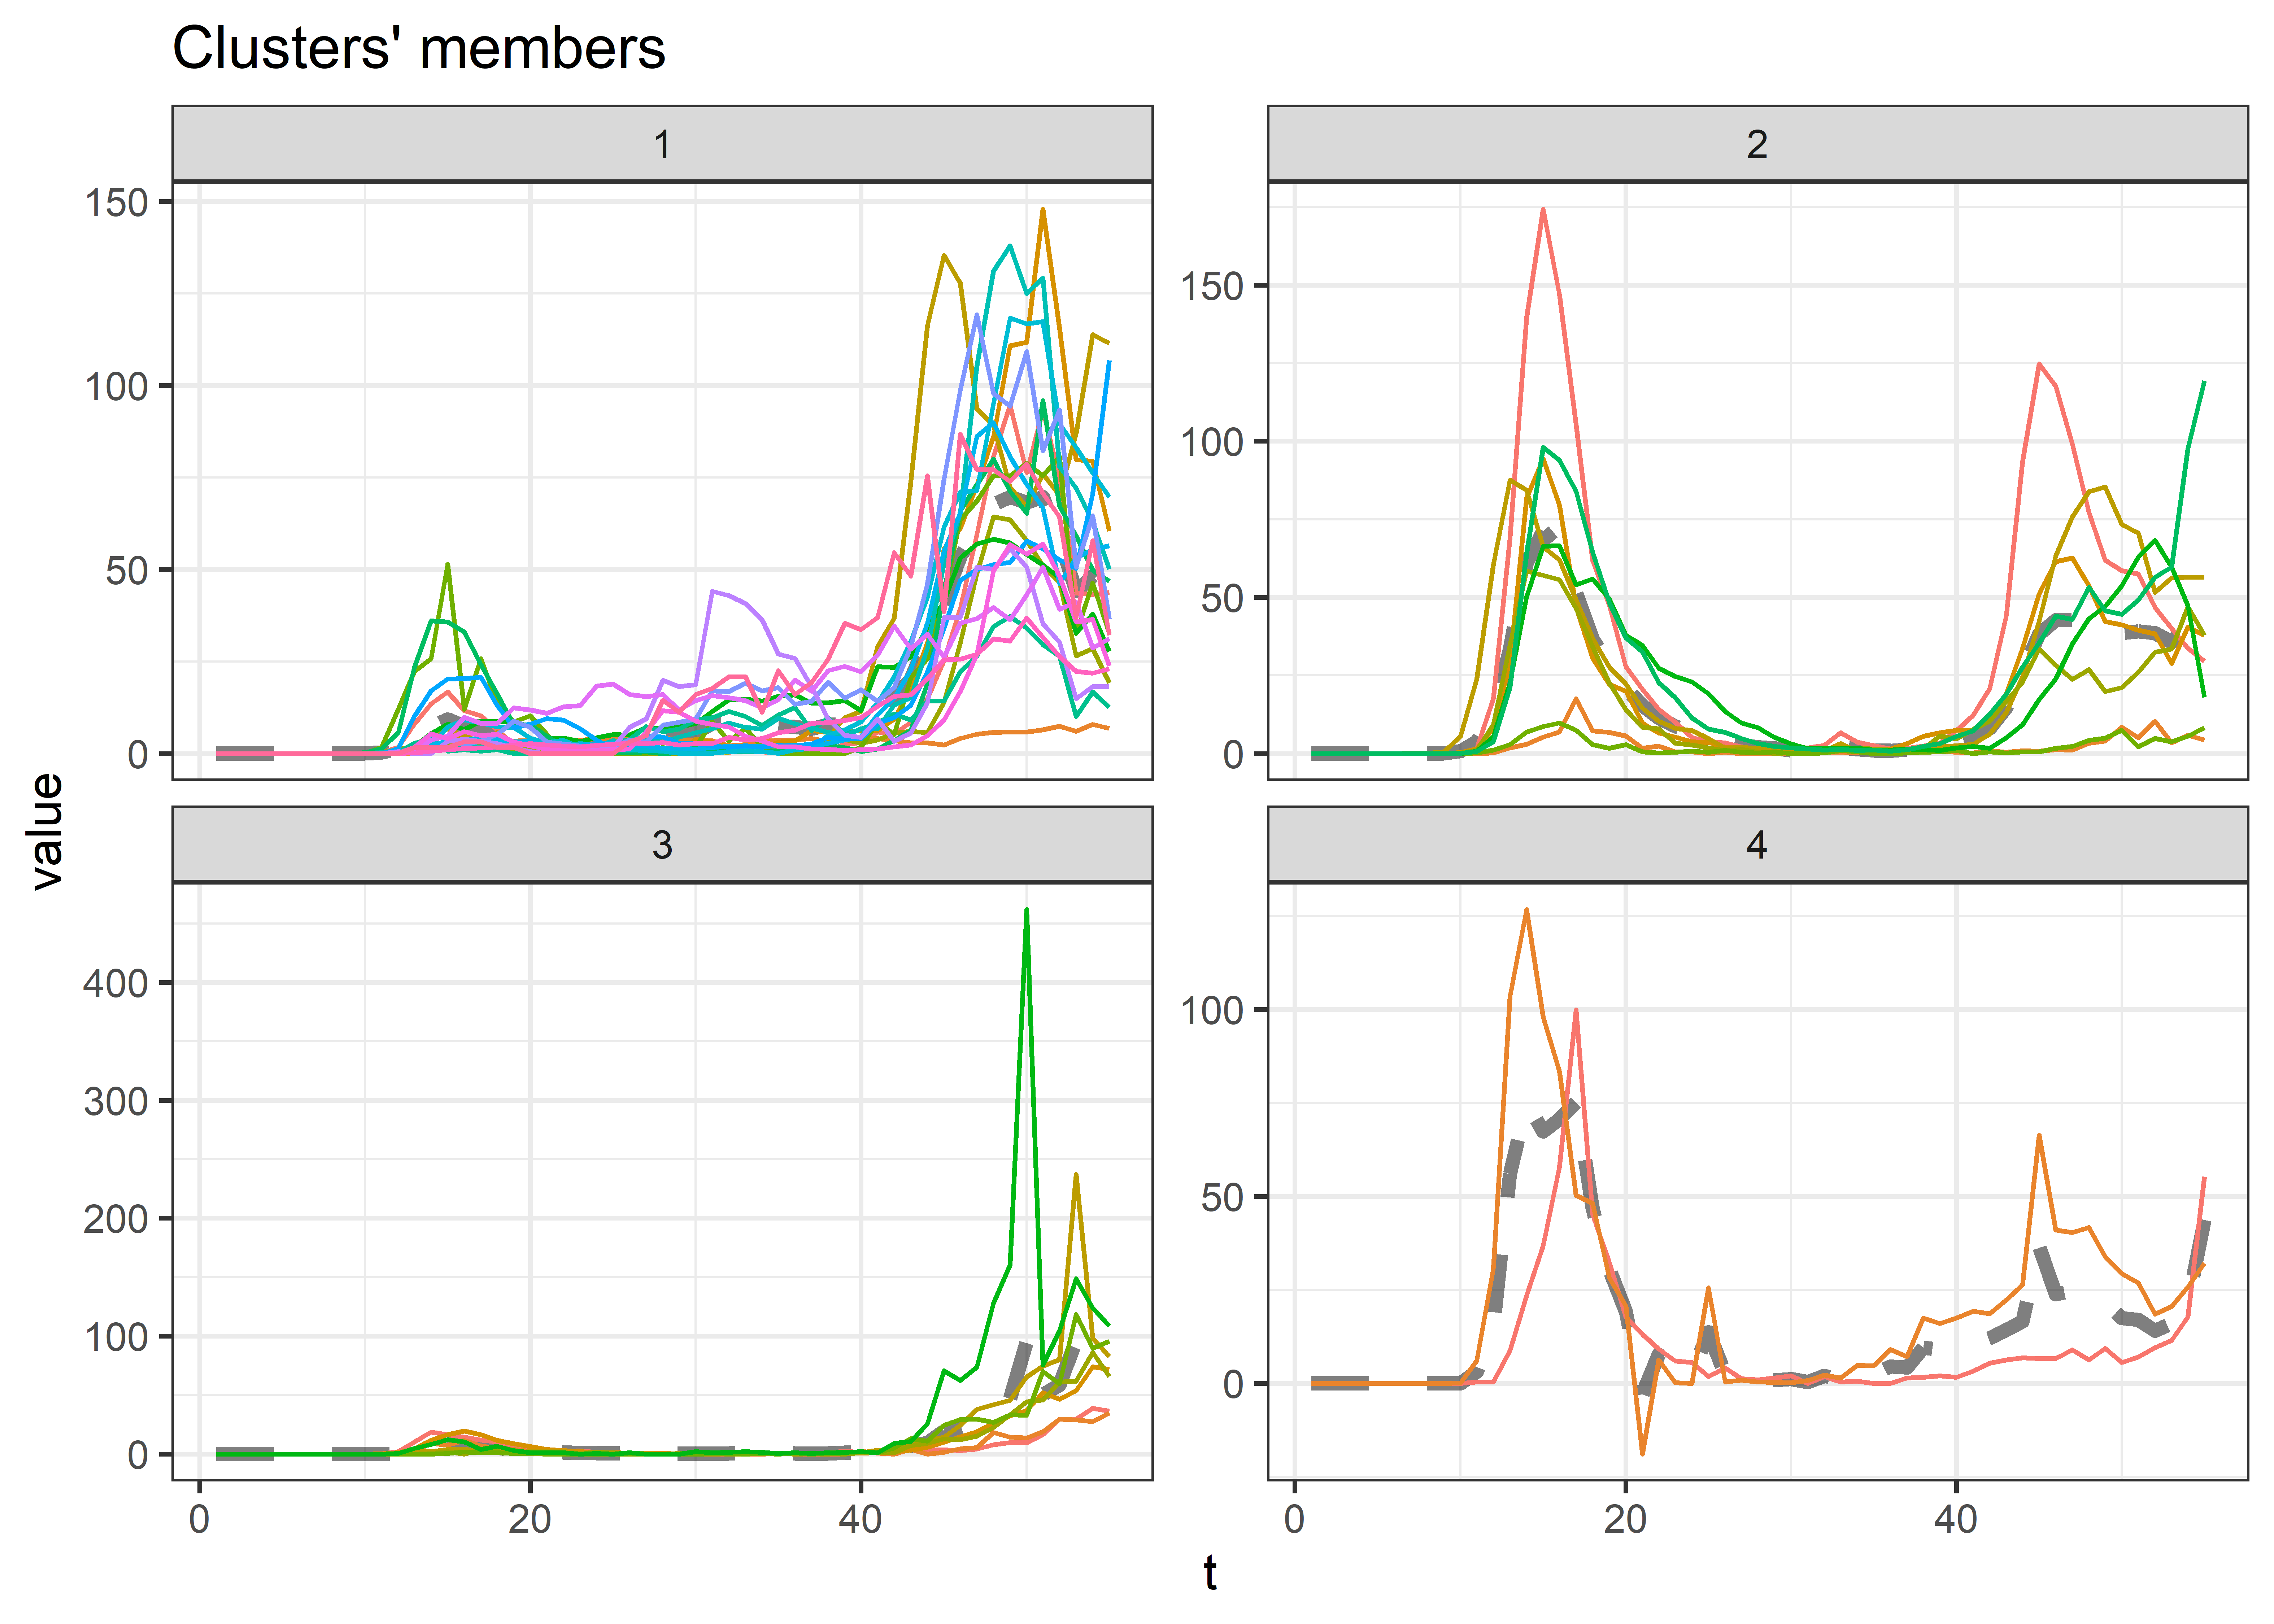
We can show this on the map again below. So it would appear there are some regional patterns in the data, with a strong East West separation of the data. However, there are some notable outliers, again flagging Portugal for example stands out as a country in Western Europe for having low spring deaths. Countries which appeared to have controlled the virus up until winter (group 2) are more dispersed than other groups.
Note, there are more ways we could explore the correlation, and the above results are by no means fully rigorous. Potentially, we could look at the total number of deaths encountered during spring and winter, and correlate these against longitude to see if there is a relationship. I purposely did not do any other approaches, as I wanted the analysis to remain as true to the original work as Joel. I would be happy to explore further if required.
So what causes this relationship?
Having established there do appear to be some patterns in the data, we can now explore a bit what might be causing this. This can be particularly tricky to do when dealing with spatial representations of data like this, as you need to think about whether the pattern is a result of another geospatial characteristic (i.e. climate), or whether there is a non-spatial issue influencing it.
Again, to be faithful to the original analysis of Joel, my attention here is focussed to the Stringency Index data provided. As explained at the start, this gives us an indication of the level of restrictions introduced. Pretty much every country follows a similar profile from April (increasing severity), slowly removing measures over the summer, and increasing the measures at Christmas. There are some notable exceptions including Belarus.
The conclusion that Joel seems to reach is that as these curves all seem to follow a similar pattern, while the death rates vary a lot by each country, we can conclude that the level of interventions do not impact deaths. The analysis claimed that because of this lack of relationship, the pattern must be explained by geography and climate. However, there is a risk that this oversimplifies the problem, as I aim to explain.
A key part of any lockdown measures is not just about how extreme the measures are, but when they are applied. This was particularly key at the start of the pandemic, as Covid-19 spread within Europe. As covered in this journal paper on the 21st February, nine countries had reported cases: Belgium, Finland, France, Germany, Italy, Russia, Spain, Sweden and the UK. At an early stage, most of these countries did not fully appreciate the risk, and there are suggestions that lockdowns occurred later than they should have. As things got worse, countries which had not yet been impacted badly had clear examples of why they should escalate restrictions.
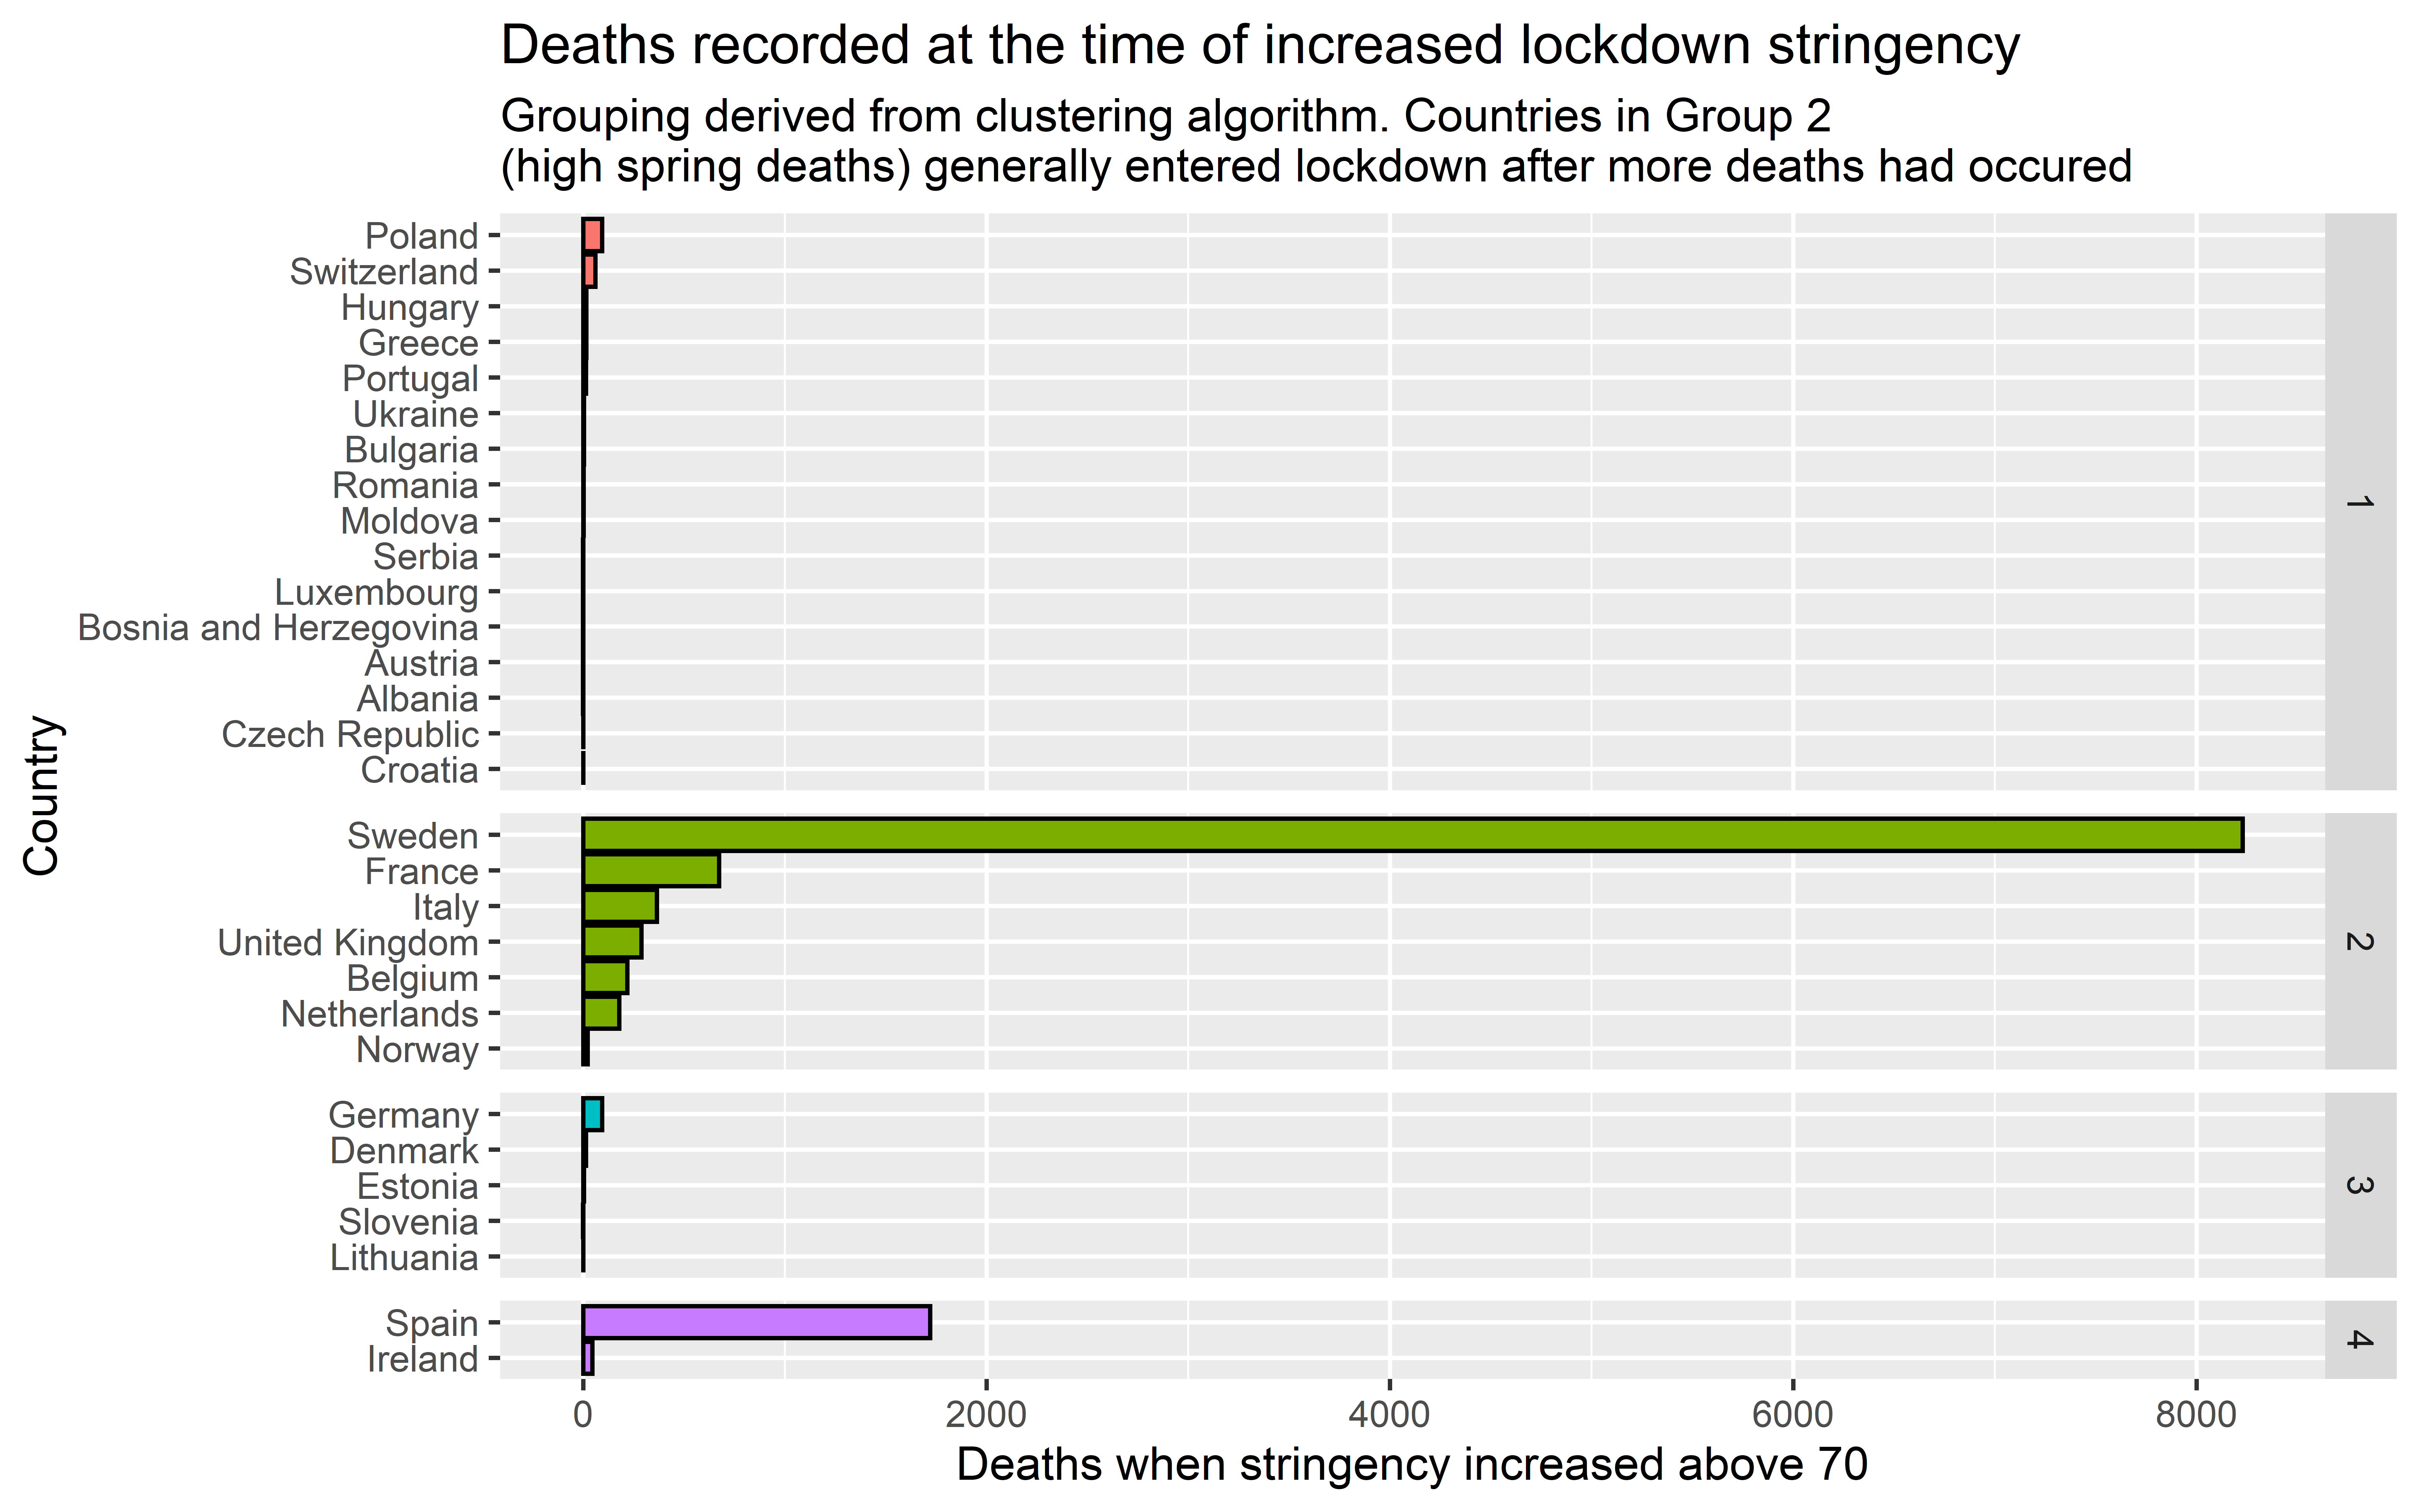
To demonstrate this, we can use the stringency index data provided. The figure below shows the number of deaths recorded in each country at the time that they increased their Stringency value to 70 (a value which represents quite a high level of restriction like lockdown), of the 9 countries which were mentioned in the paper above, 5 of them were classified into the “Group 2”
This point is not a new point. It has been covered within news Guardian, or particularly regarding Portugal here. I know there can be mistrust around the main stream media, but these articles base their conclusions partly on the same dataset which Joel is using here.
I would say this analysis is not perfect: there is definitely more to consider than just when the country entered lockdown. But my sole aim here to is show that it at least has some relationship, and therefore the claims made by Joel that there seemed to be no relationship appear false.
Note, this data only provides a weekly summary, which makes it less ideal than the daily updating datasets, but it should be good enough to demonstrate the point. Ideally more detailed analysis should be conducted here whereby the actual day of lockdown was used. Within the exponential growth of the virus, the difference of a few days can have a large impact on the deaths, especially back in March 2020.
Are there other factors at play?
A lot of the discussion in the comments were discsussing the importance of climate of Covid. The analysis presented here provides no evidence to directly support or refute this: this would not be possible to do without referring to weather datasets and including these within the analysis. Using the same argument though, the evidence presented in the original analysis provides no evidence to directly support this claim. However, we can refer to existing literature. which suggests that while climate does influence Covid, it cannot explain the majority of the variation as claimed by Joel. For example: review paper:
“Considering the existing scientific evidence, warm and wet climates seem to reduce the spread of COVID-19. However, these variables alone could not explain most of the variability in disease transmission. Therefore, the countries most affected by the disease should focus on health policies, even with climates less favorable to the virus. Although the certainty of the evidence generated was classified as low, there was homogeneity between the results reported by the included studies.”
I would therefore disagree with the evidence presented in the original analysis that climate can be derived as a clear cause of this. However, it would be a topic which could be explored further by Joel.
Conclusion
Have you made it this far through the article? Well done if you have! I appreciate it is long, but that’s science for you, and if you want to get the full picture, you sometimes need to dig below the Twitter post! In answer to the three questions I rased at the start of this analysis:
- There is some evidence of East/West Covid differences The original post infers that there is correlation between longitude and the patterns in Covid deaths. However, this has all been derived by visual inspect of the graphs, and no numerical value is provided. This analysis did some further modelling to assess the similarity and has shown that there is indeed some patterns in the data, and there were some patterns of East and West, however significant outliers were present.
- The claims that geography are the cause seem flawed I would strongly disagree with the conclusions reached that geography is the biggest influence here. The evidence presented by Joel is primarly the visual inspection of graphs. As shown in this analysis, the speed of the response to the first lockdown provides a clear relationship between the East and West.
- Lockdowns in spring do appear to have an impact: the original analysis from Joel only seemed to look at the general profile of the lockdown stringency, and did not take into account the time at which stringency increased (not just the value of the metric provided). As shown here, there is a clear relationship between countries which locked down later and had larger increases in the Spring Covid-19 spike.
- Claims about climate provide no support: there is no analytical justification for this conclusion reached. I am not entirely dismissing this as a potential factor, and literature does suggest it has an influence, but the analysis does not include sufficient data to make the claims it does.